Dead Stock Prediction Using Machine Learning
End to end ML workflow on 3,000 inventory records that flags at risk products before they tie up cash and warehouse space.
Read Case StudyData Scientist · Sydney based · Open to remote
I like the messy part: taking chaotic data and making it undeniable.
Graduate Temporary Visa (subclass 485) · Full unrestricted working rights in Australia
Featured Work
Hand picked case studies that show how I move from messy data to decisions a business can actually act on.
End to end ML workflow on 3,000 inventory records that flags at risk products before they tie up cash and warehouse space.
Read Case Study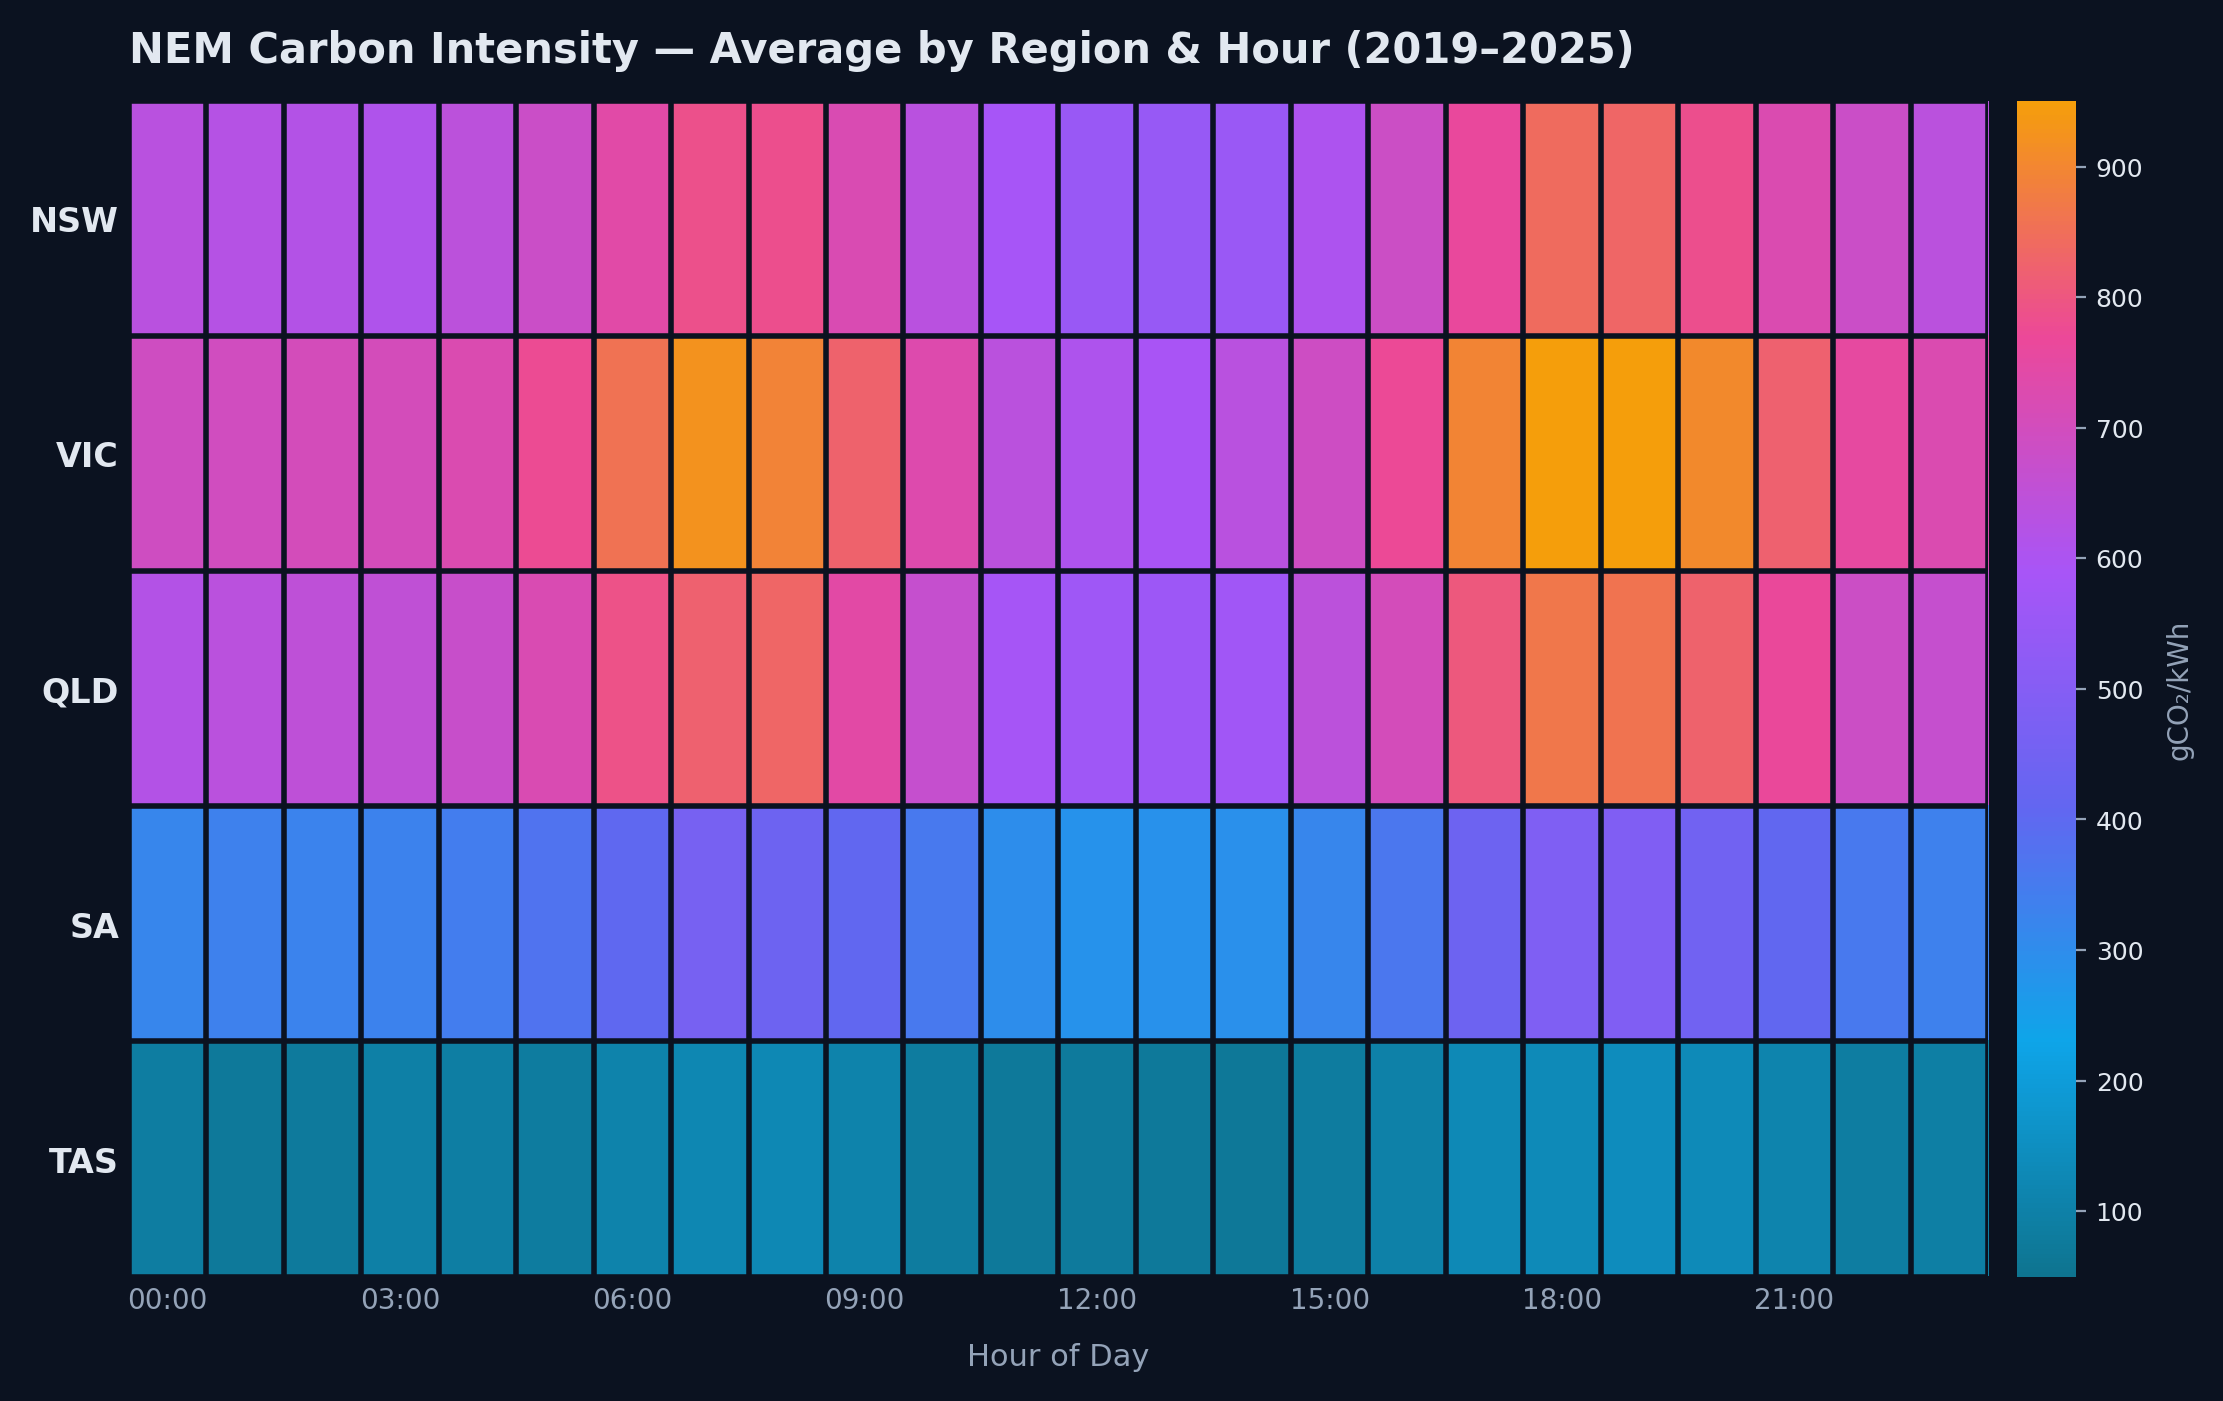
Six years of Australian electricity market emissions mapped across five states to surface clean and dirty windows.
Read Case Study01: About
I studied Computer Science, which pulled me into data and a year of machine learning research. The technical side came easily, but I kept hitting the same wall: I could build the model, not always frame the business question behind it. So I pursued a Master of Business Analytics at Macquarie University to close that gap. The projects I've enjoyed most since sit at the intersection of technical rigour and real business stakes: energy market analysis, carbon emissions modelling, retail forecasting. I care less about the tools (Python, SQL, Power BI) than what they let me do, which is turn ambiguous problems into clear recommendations. I'm looking for Data Analyst roles where turning messy data into clear decisions is the job.
Master of Business Analytics
Macquarie University
Predictive Modelling
Churn Prediction · Inventory Risk · Forecasting
Data Visualisation
Power BI · Tableau
SQL & Analytics
MySQL · PostgreSQL · Business Reporting
02: Journey
A decade of learning, research, moving countries, and building toward a career in data.
North South University, Dhaka, Bangladesh. Built a foundation in algorithms, software engineering, and research methods.
North South University. Prepared datasets, trained models, and evaluated object detection pipelines using YOLOv5 and Detectron2.
Macquarie University, North Ryde, Australia. Bridged technical depth with business storytelling, stakeholder communication, and decision science.
Macquarie University. Recognised for analytical rigour and delivering business impact under tight deadlines.
Building a public portfolio of analytics work across energy, retail, and business domains.
Joined Payreq in Haymarket, Sydney, where I analyse production database schemas and map cross-domain relationships to author PostgreSQL queries feeding Tableau dashboards with validated metrics. I run structured JOIN-based data completeness tests to surface and resolve quality gaps before reporting.
03: Skills
Technologies and techniques I use regularly, grouped by domain.
04: Education
Achievements: 2nd Place: Business Analytics Capstone Project Competition (2025)
Achievements: Cum Laude Distinction
05: Certifications
Credential ID: 48,570,070
Cloud deployment models (public, private, hybrid), IaaS/PaaS/SaaS service models, data regulations and PII, and a comparative analysis of AWS, Microsoft Azure, and Google Cloud.
Data transformation in Power Query, building interactive reports and dashboards, and applying filters and slicers for business insights.
Credential ID: 354,956
Combining data vertically with UNION to stack rows from multiple tables into a single result set, plus INNER, LEFT, RIGHT, and FULL joins for relational analysis.
Credential ID: 325422
Conditional aggregation, GROUP BY, HAVING, CASE statements, COUNT DISTINCT, and scalar subqueries.
05: Projects
Real world projects across forecasting, predictive analytics, business intelligence dashboards, SQL, and applied machine learning research.
Forecasting, predictive analytics, and exploratory business analysis.
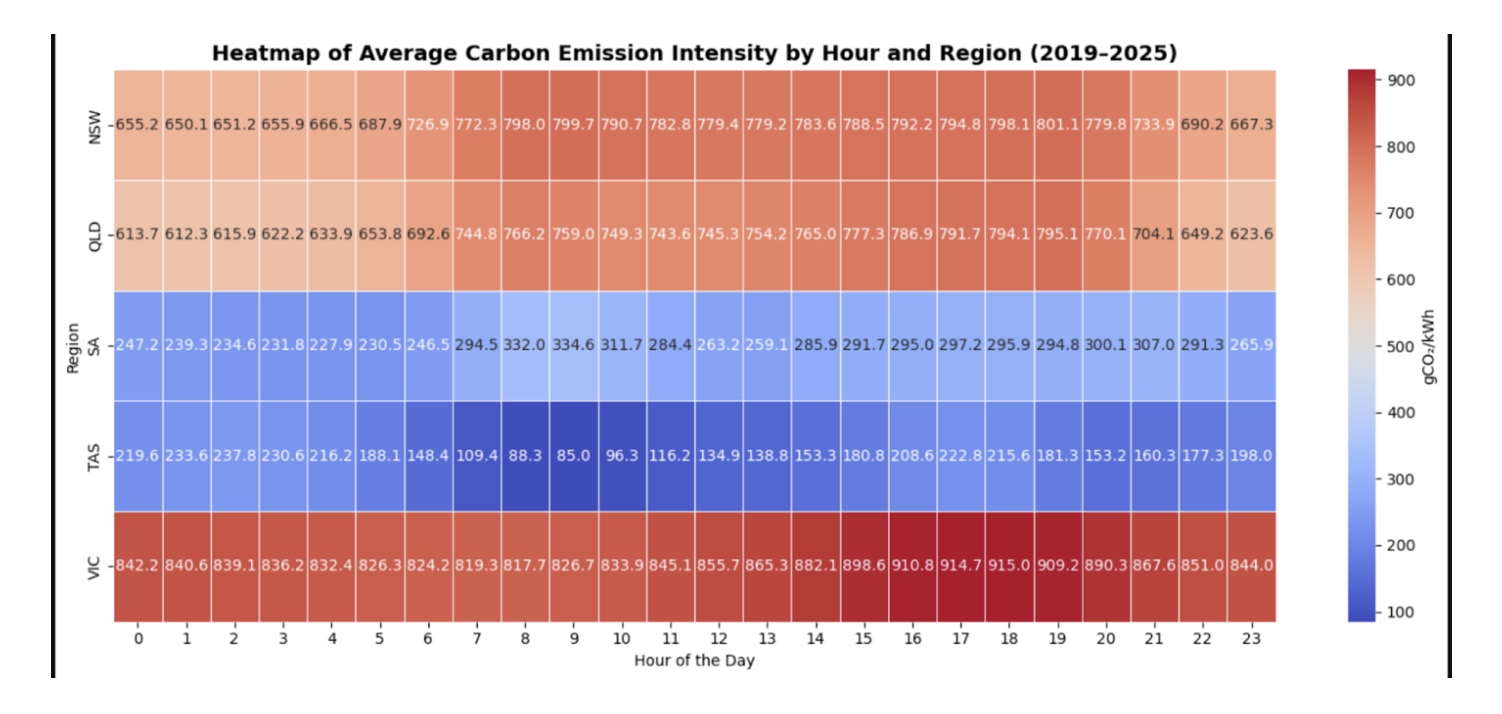
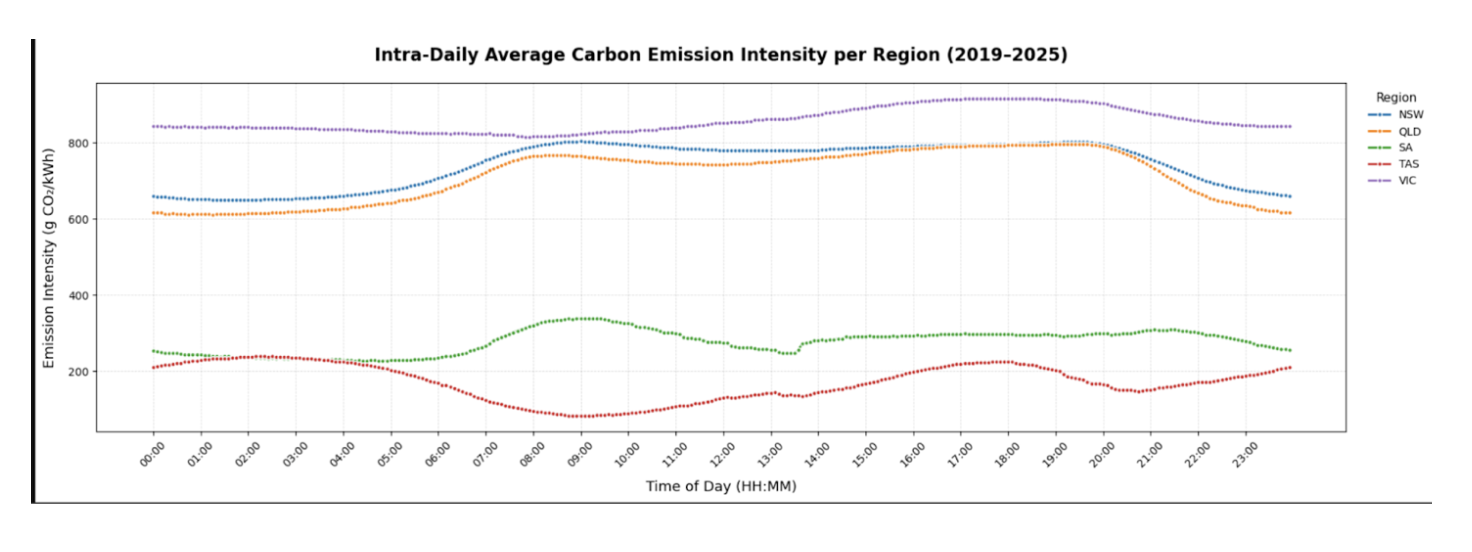
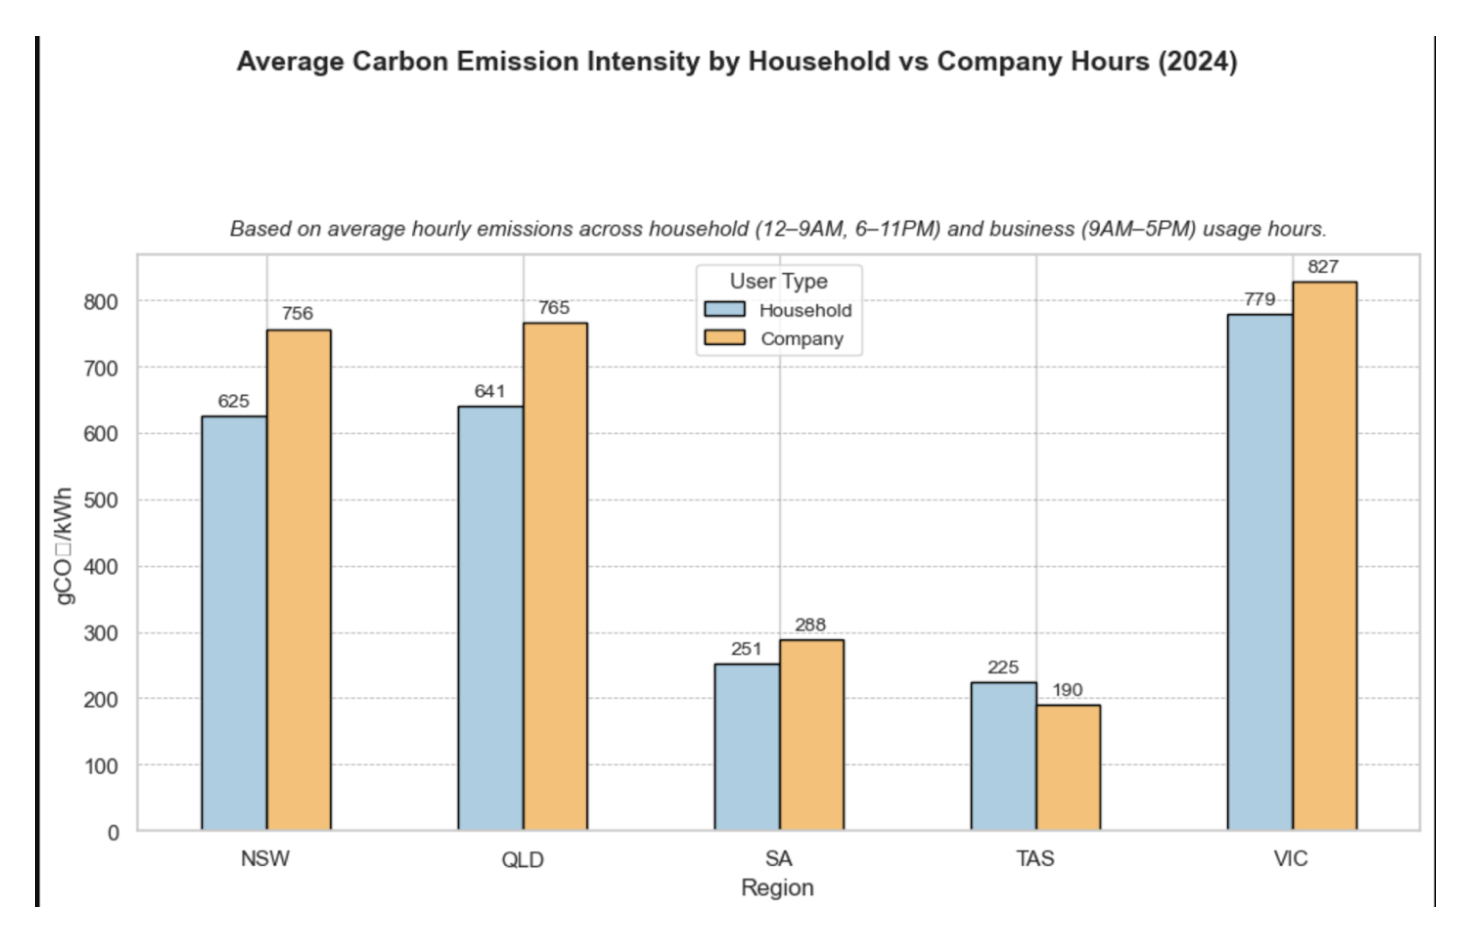
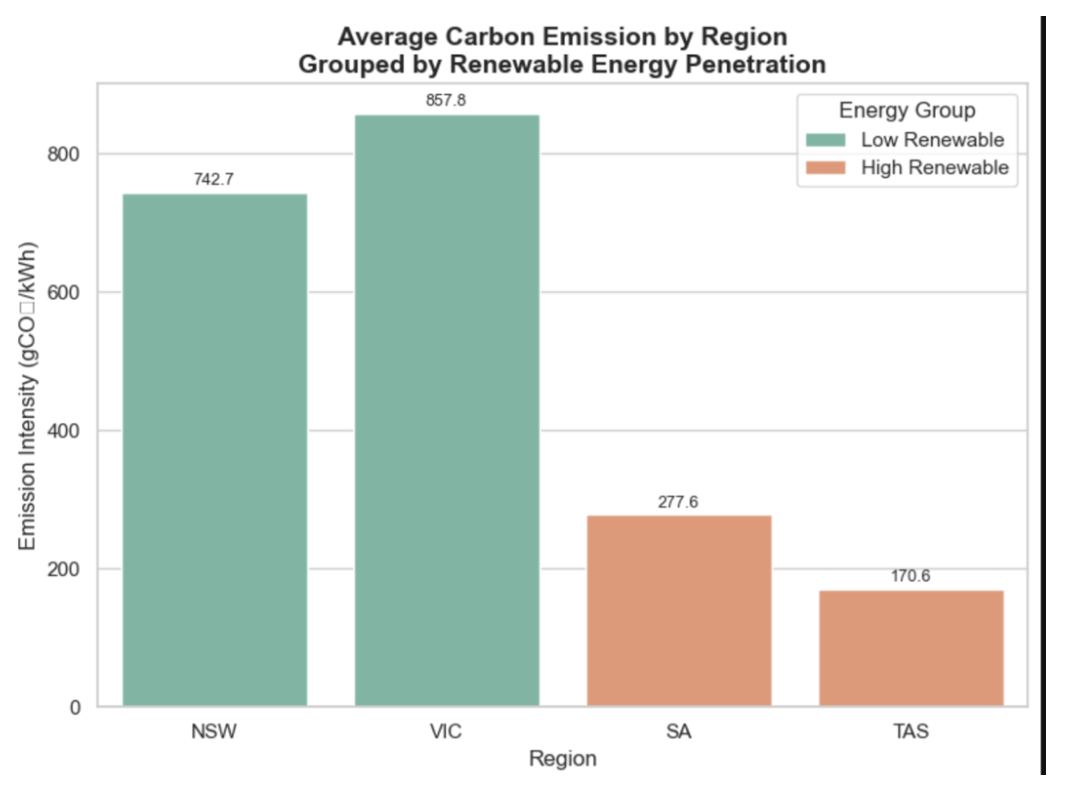
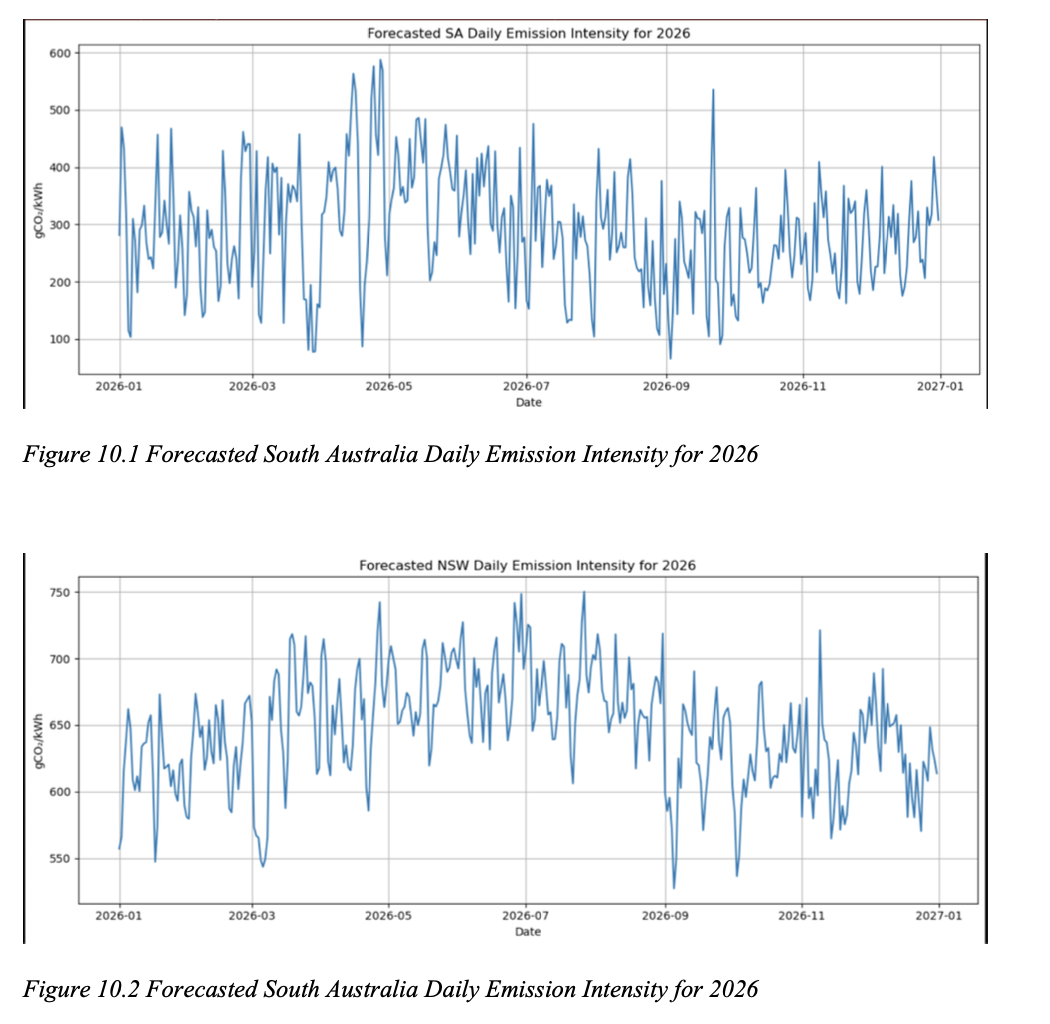
Analysed six years of Australian National Electricity Market carbon emission intensity data across NSW, VIC, QLD, SA, and TAS to identify high emission peak periods, low emission usage windows, and regional emission drivers.
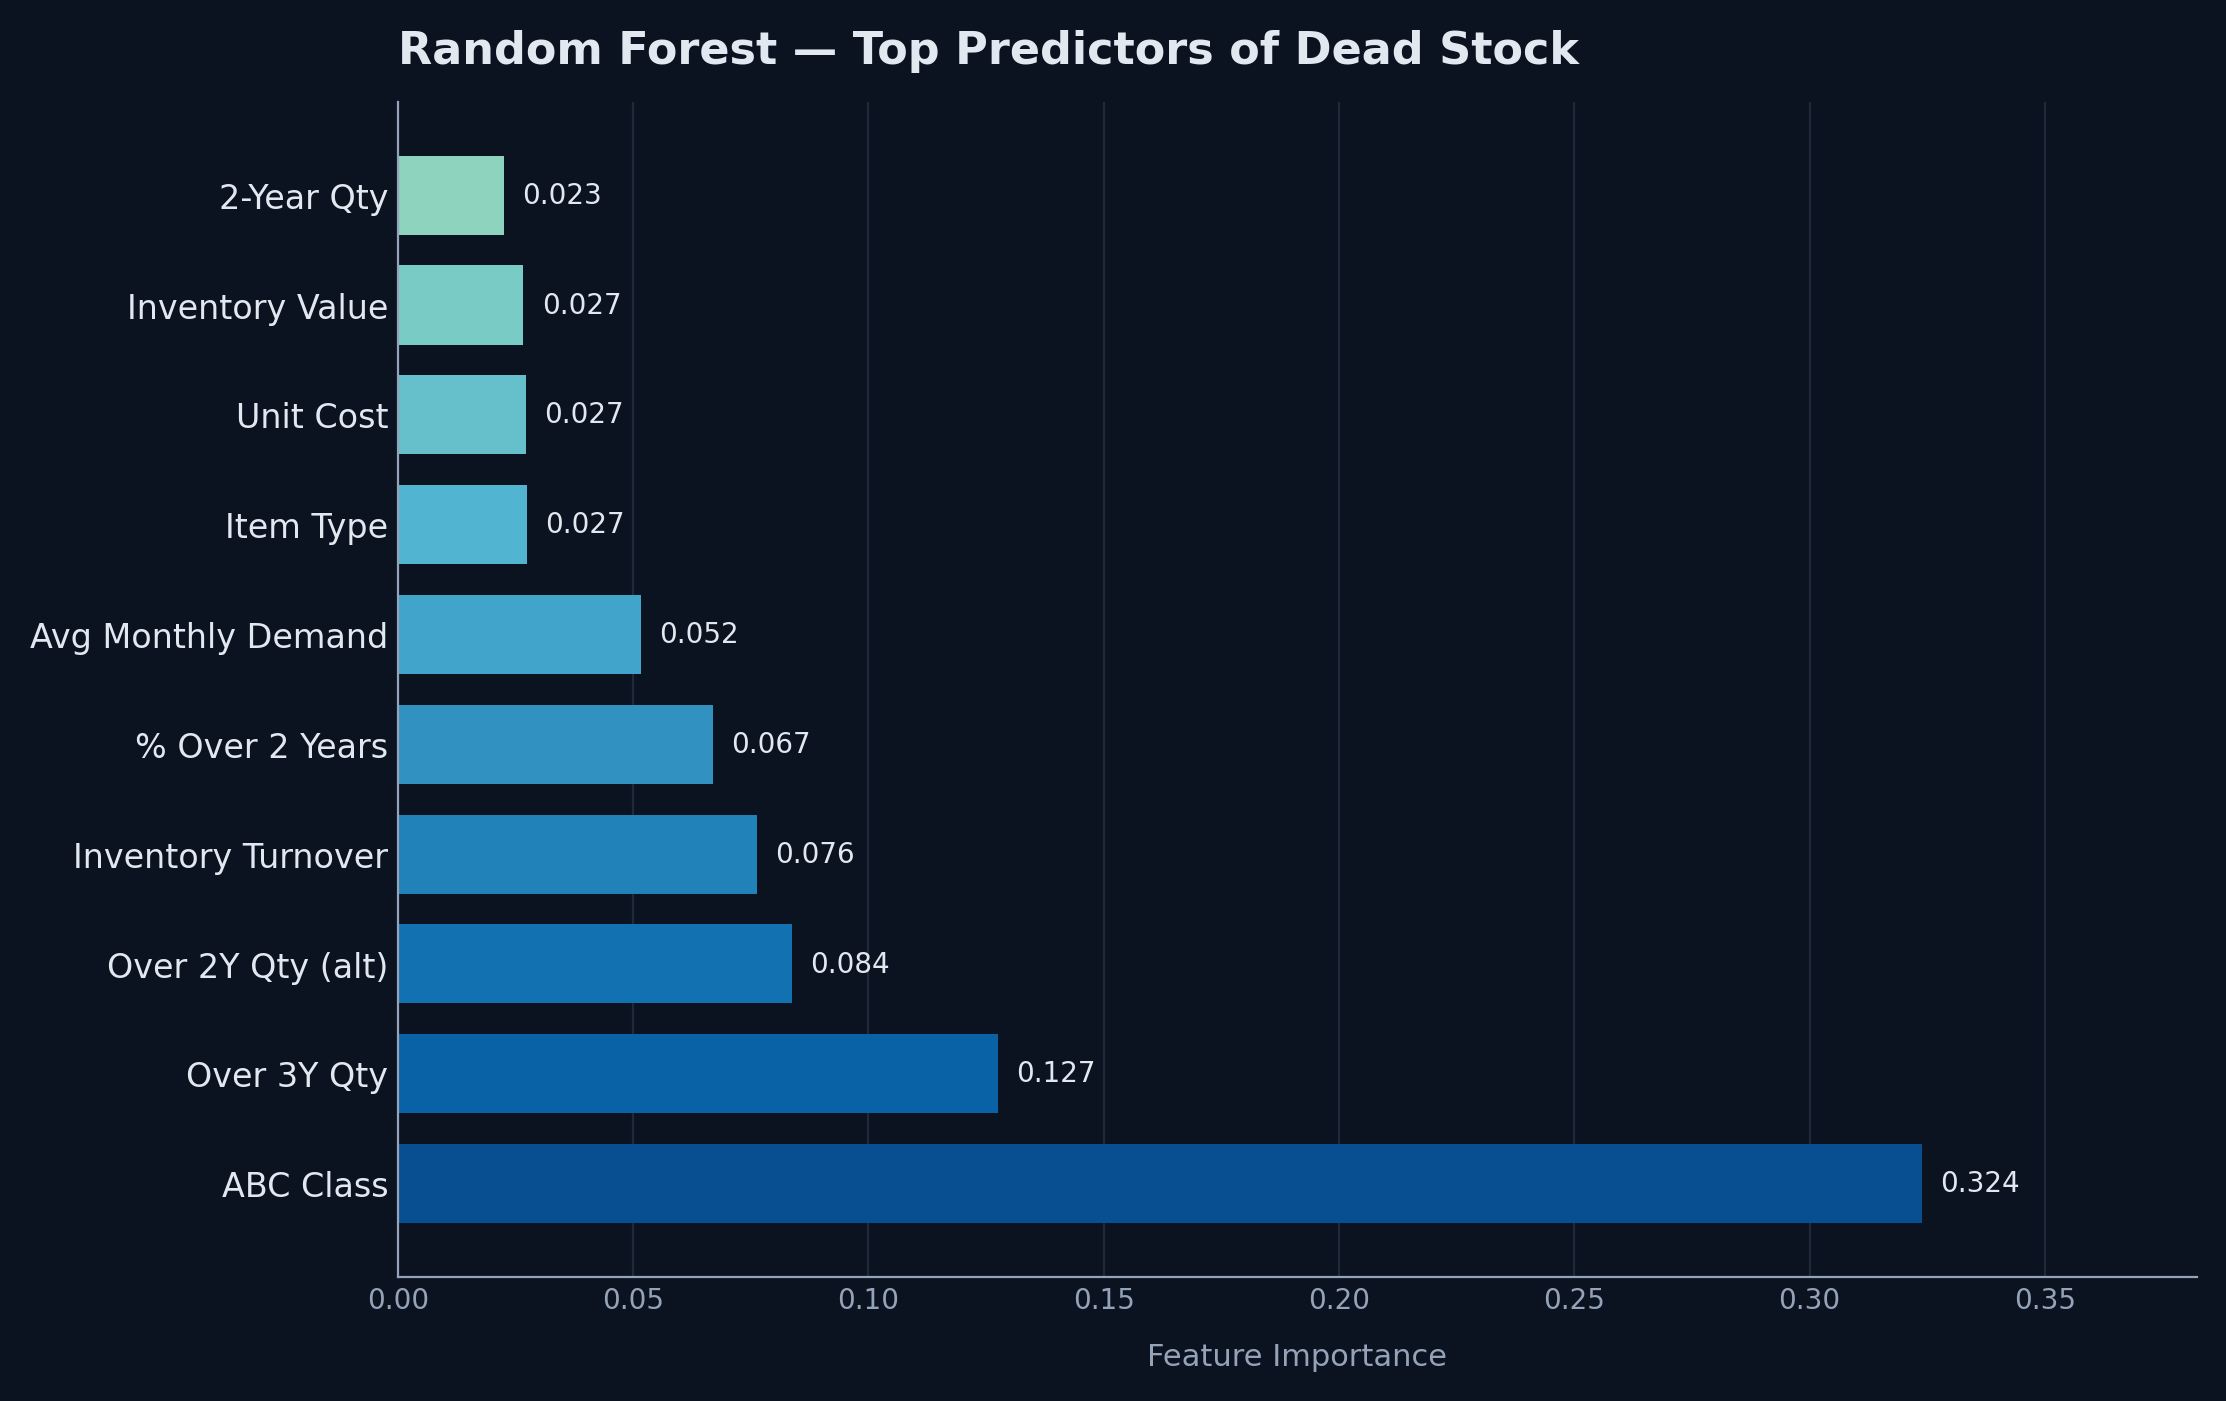
Built an end to end predictive analytics workflow using 3,000 inventory records to identify products at risk of becoming dead stock across stock ageing, monthly demand, inventory turnover, ABC classification, and warehouse movement variables.
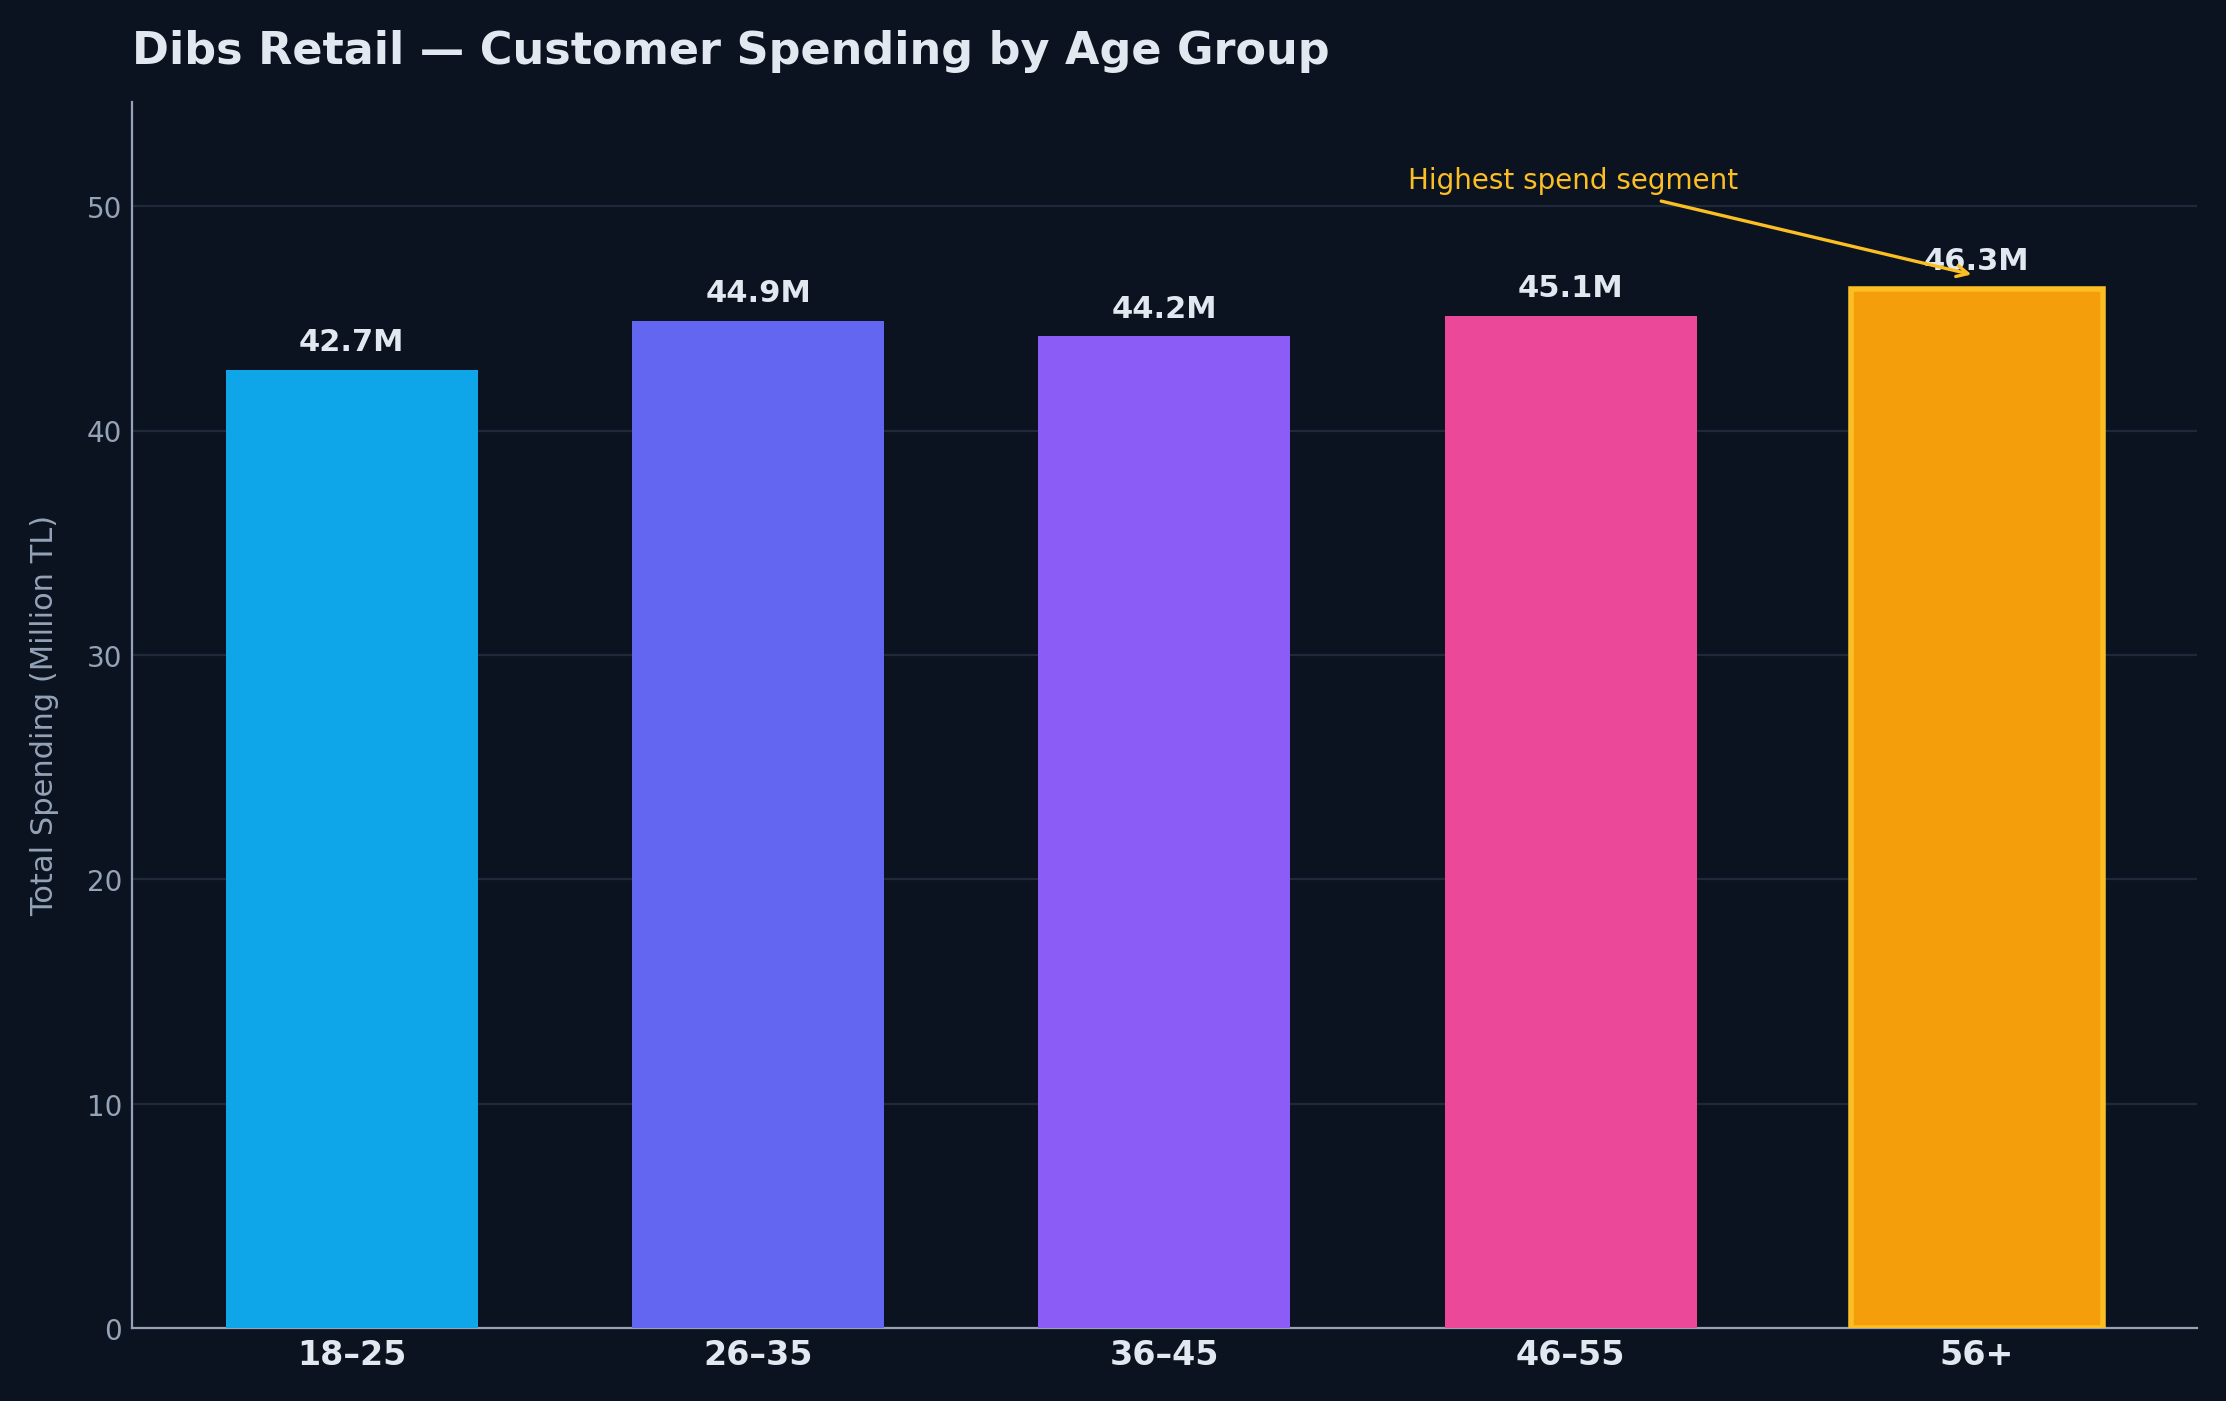
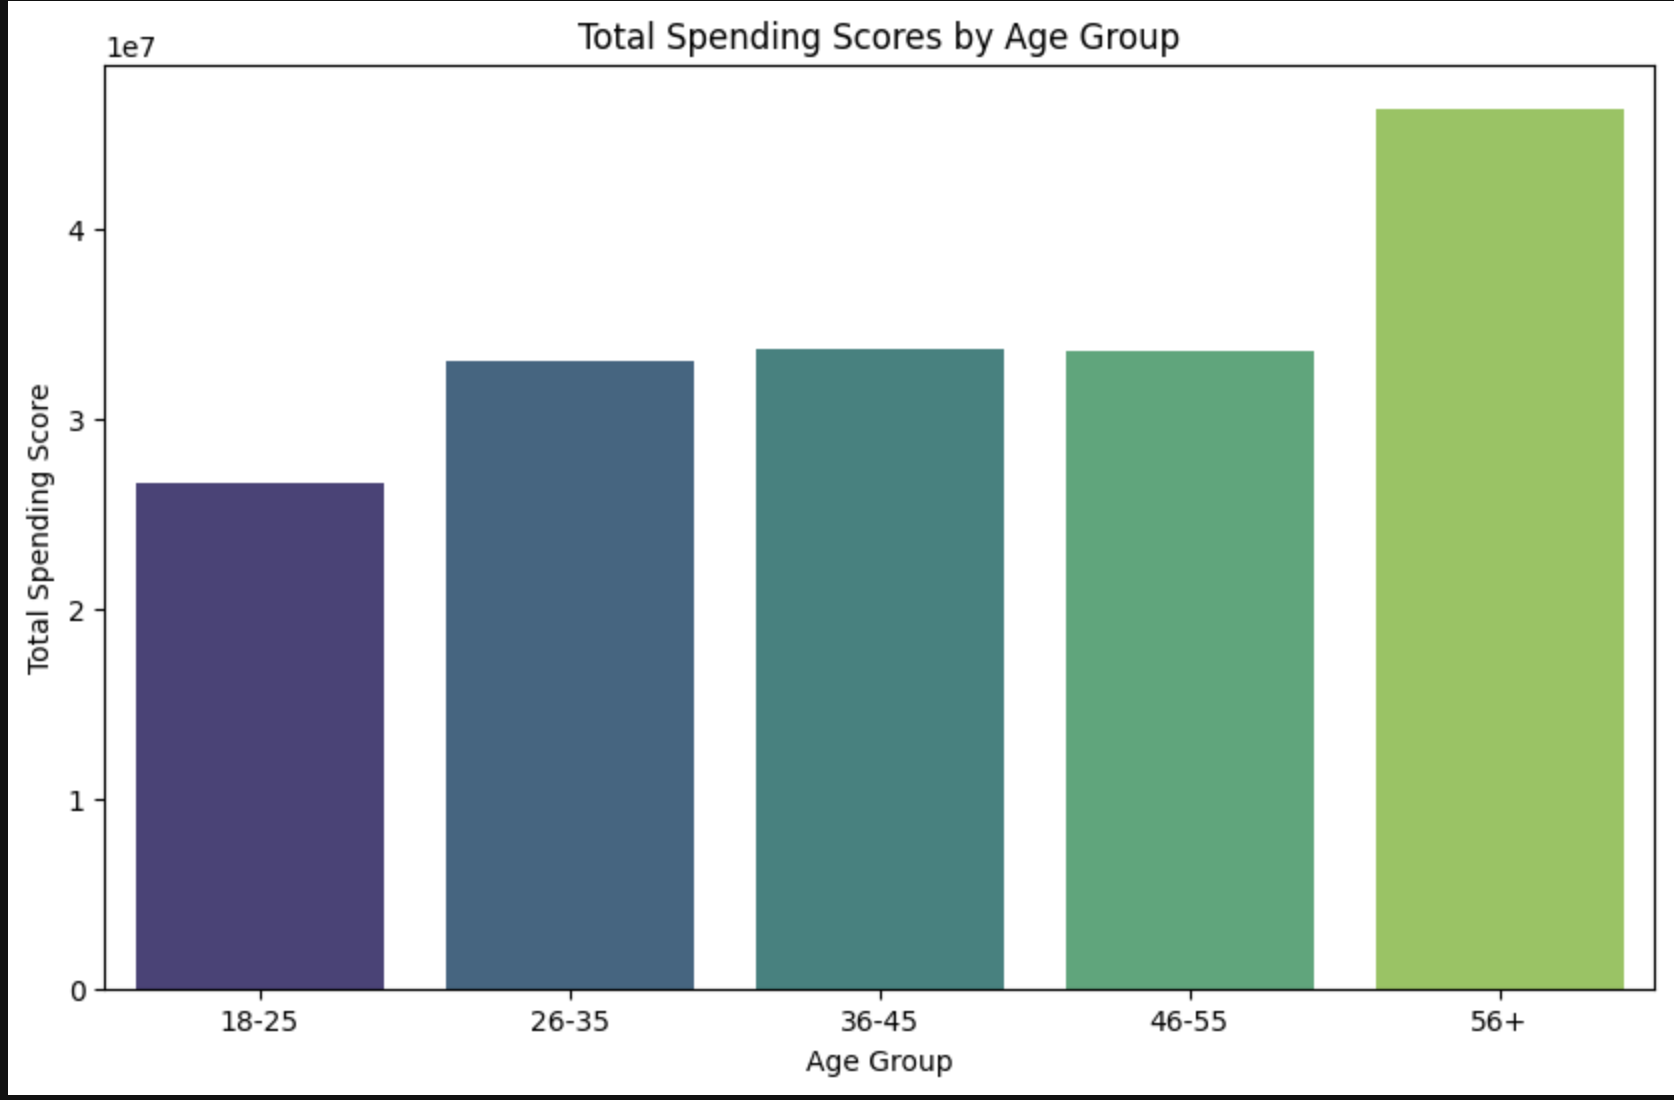
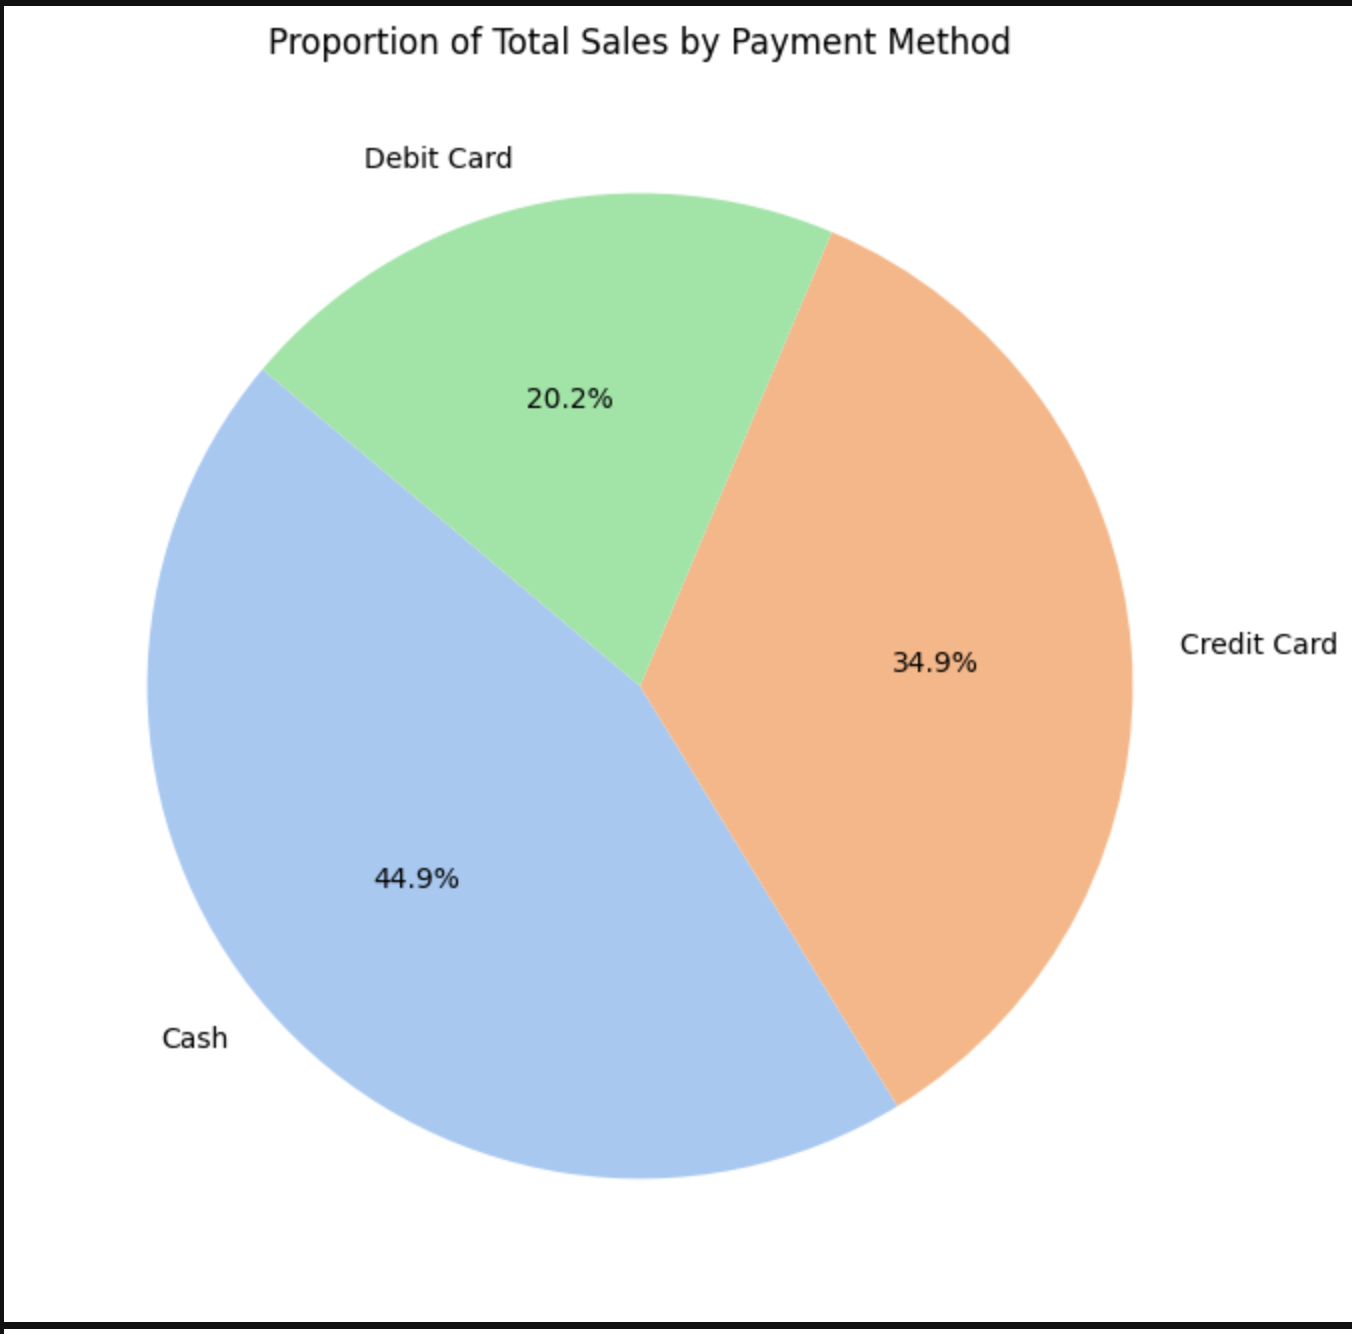
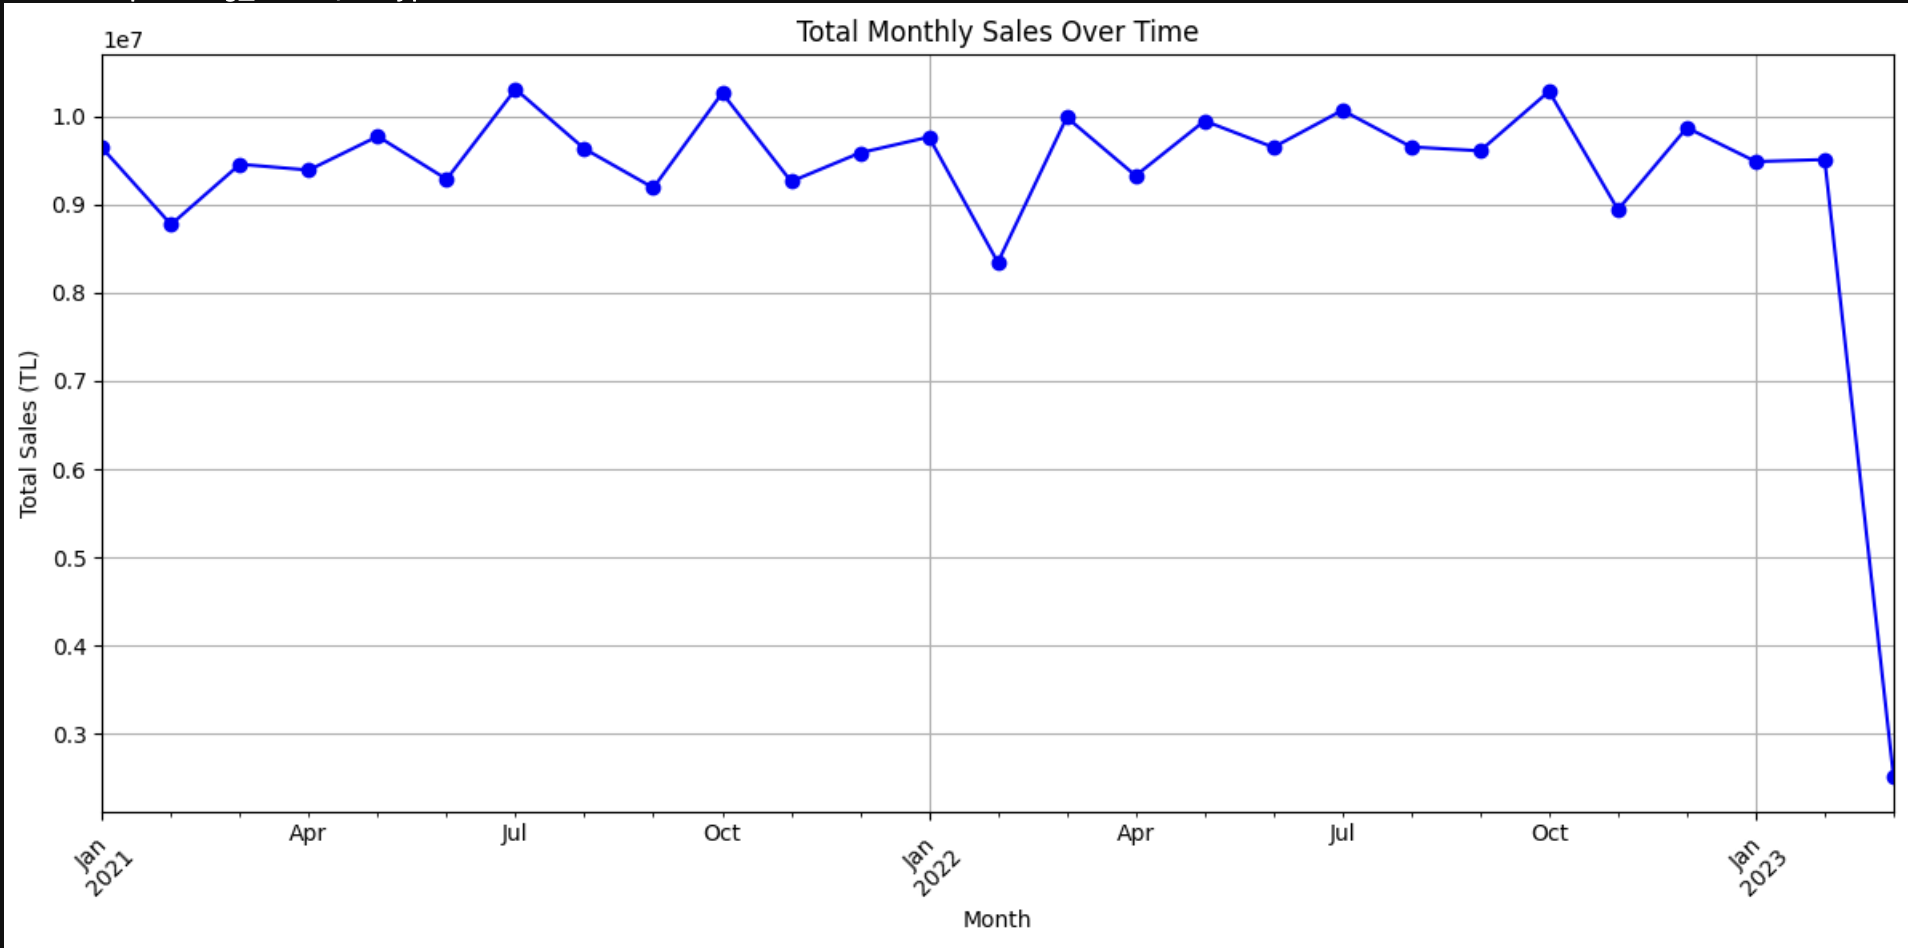
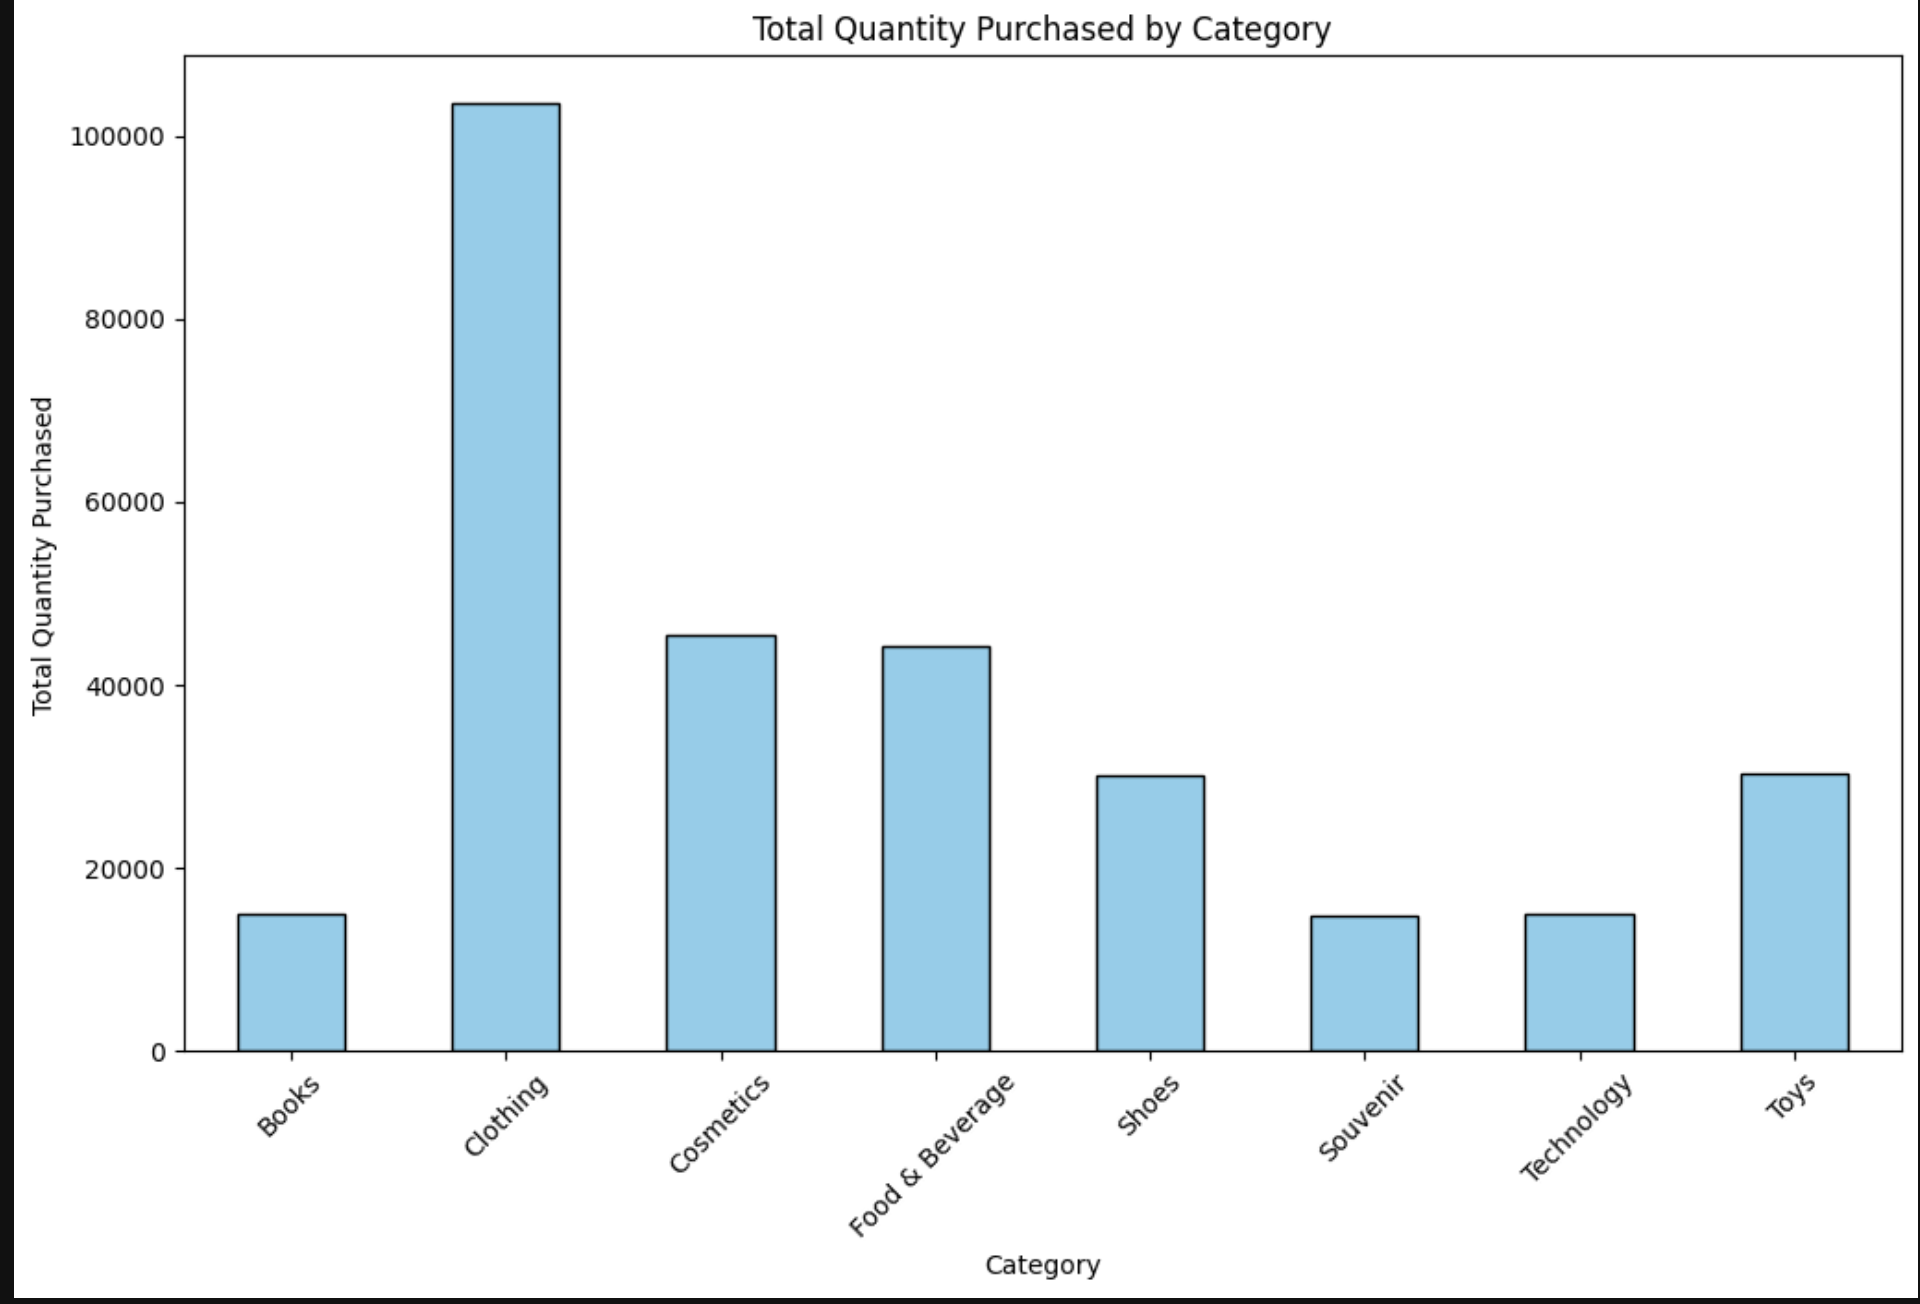
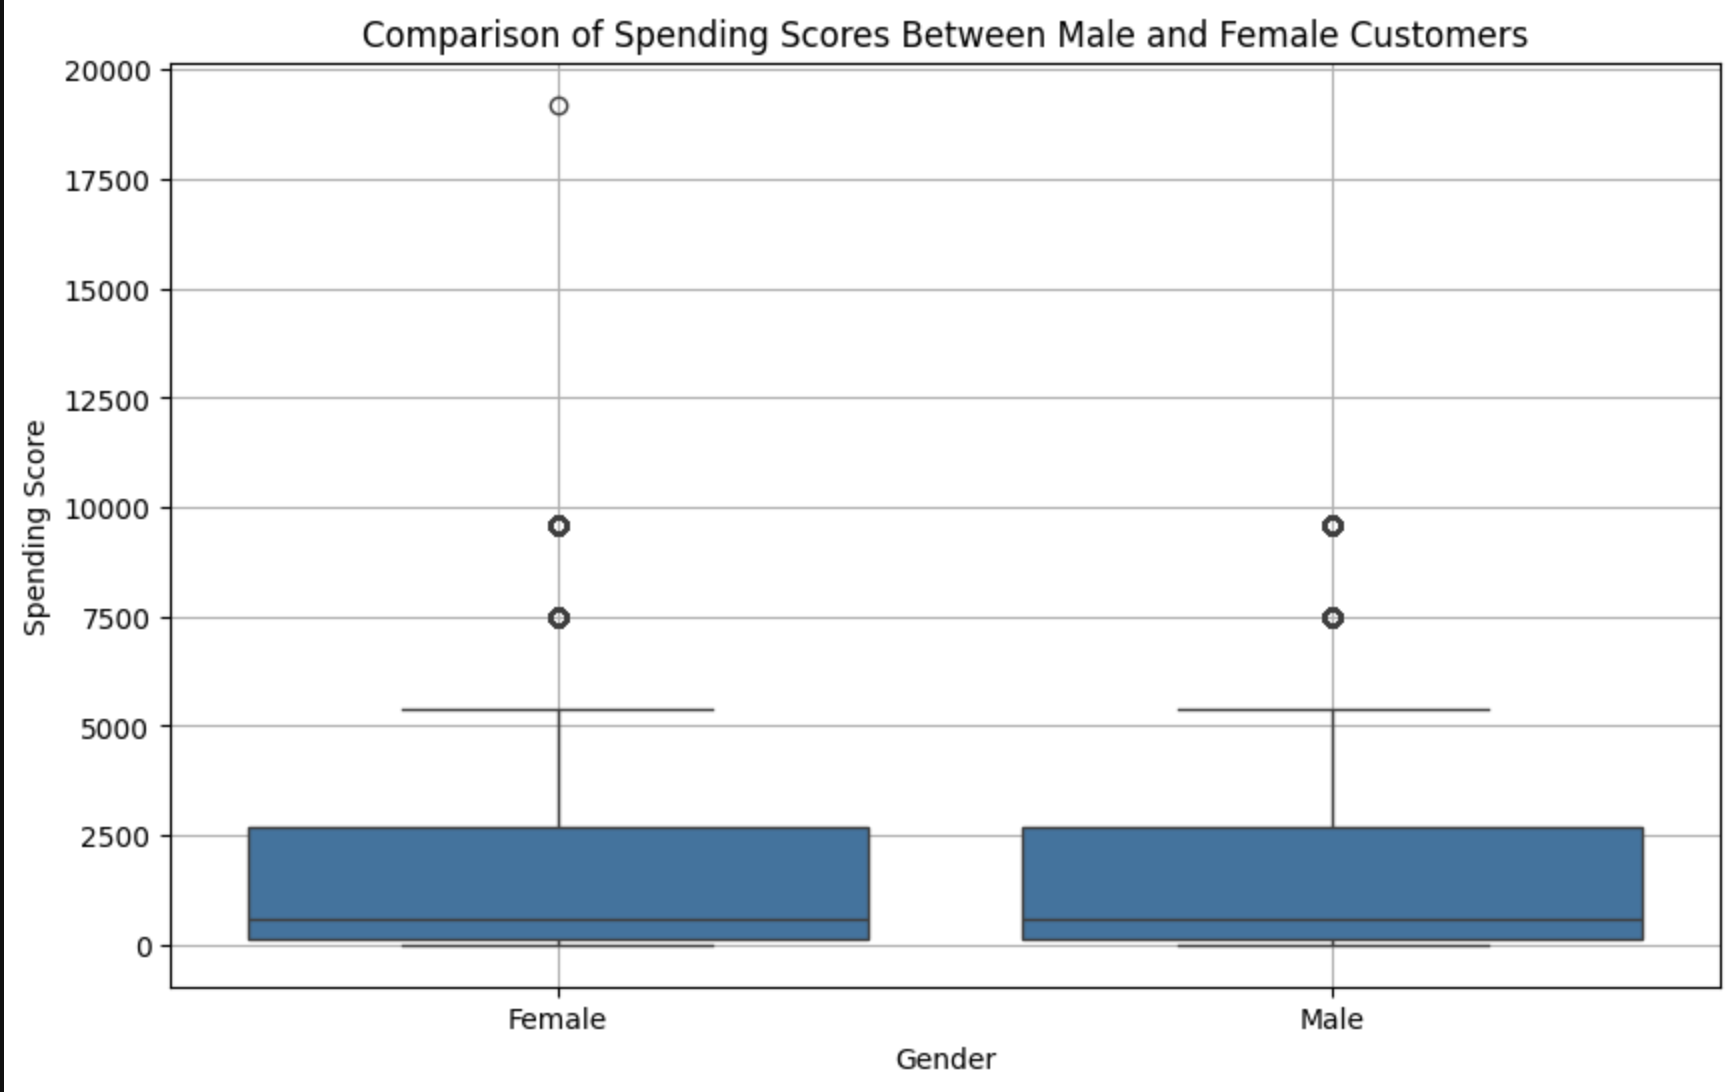
Analysed 99,461 retail transactions across customer, product category, payment method, date, quantity, price, and shopping mall variables to identify revenue drivers, customer behaviour patterns, and marketing opportunities.
SQL analytics, data modelling, and interactive dashboards.
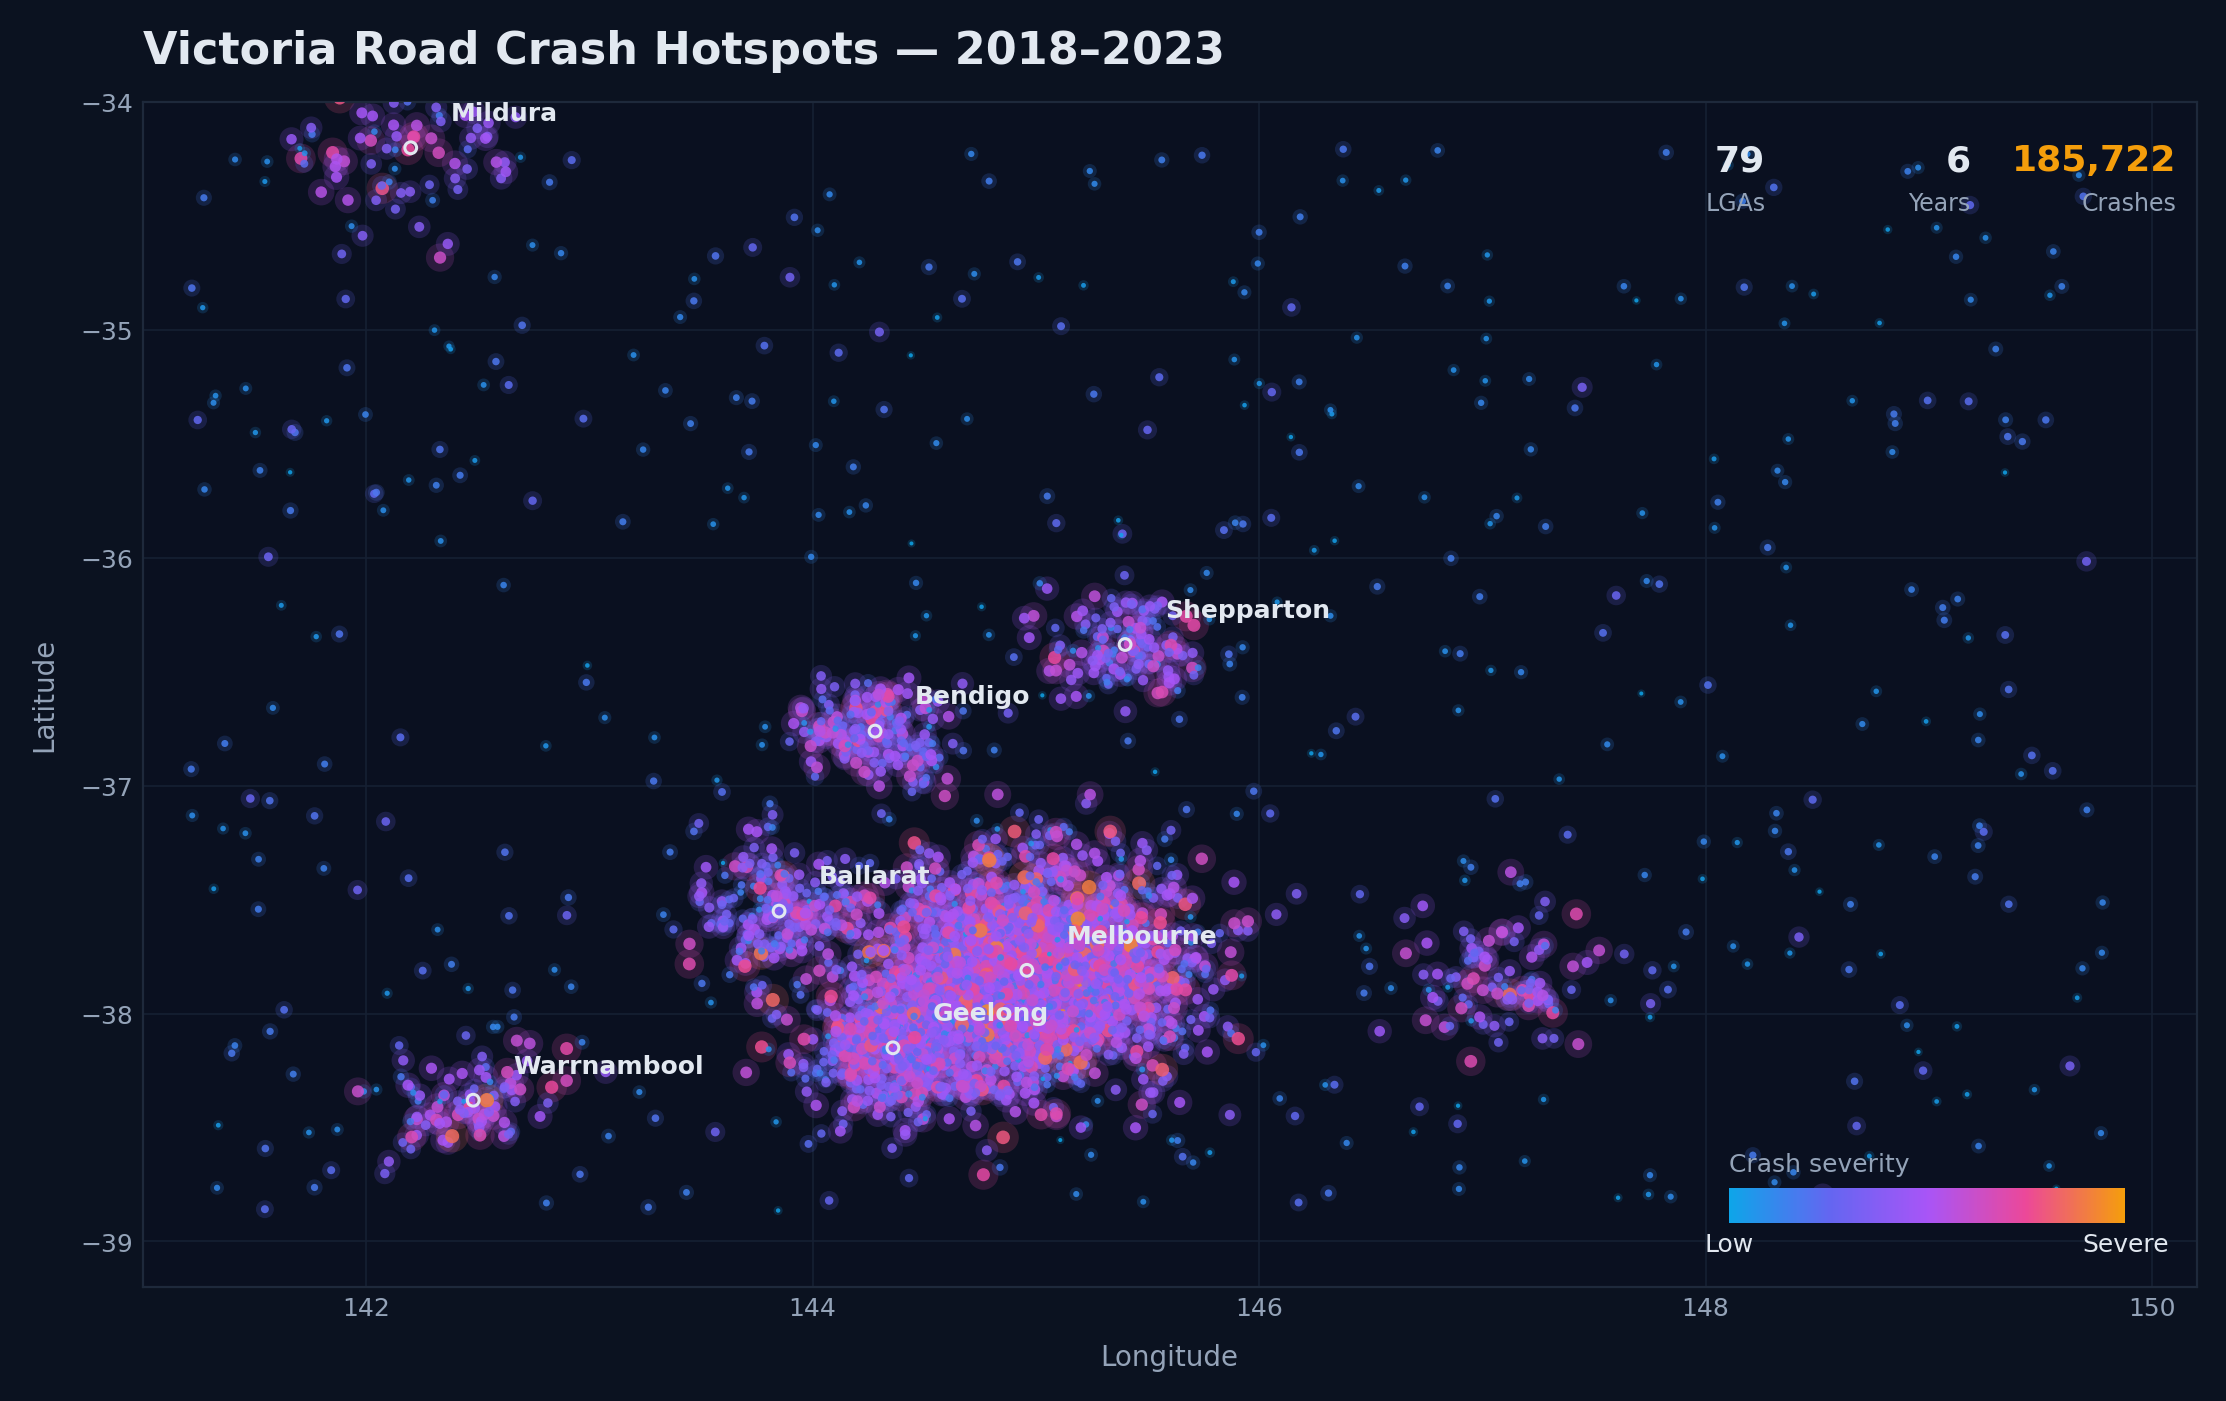
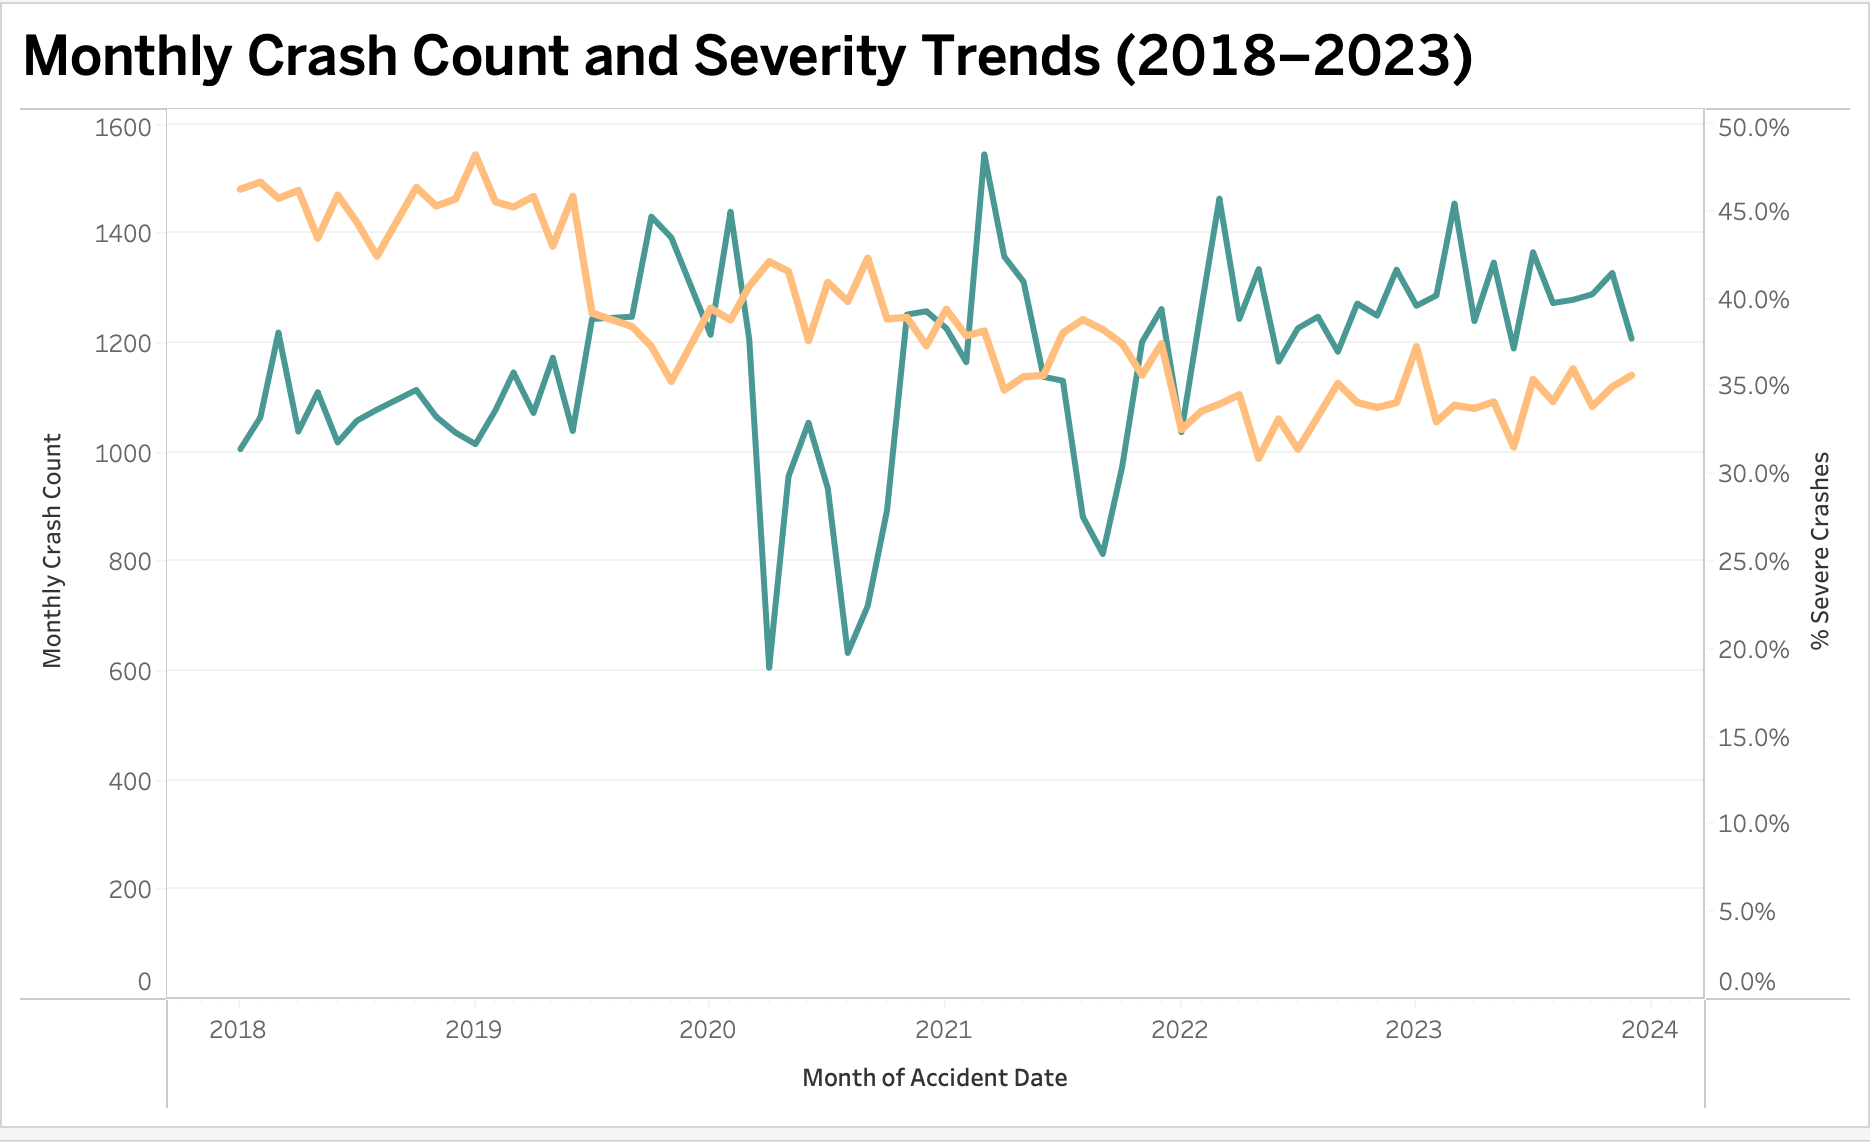
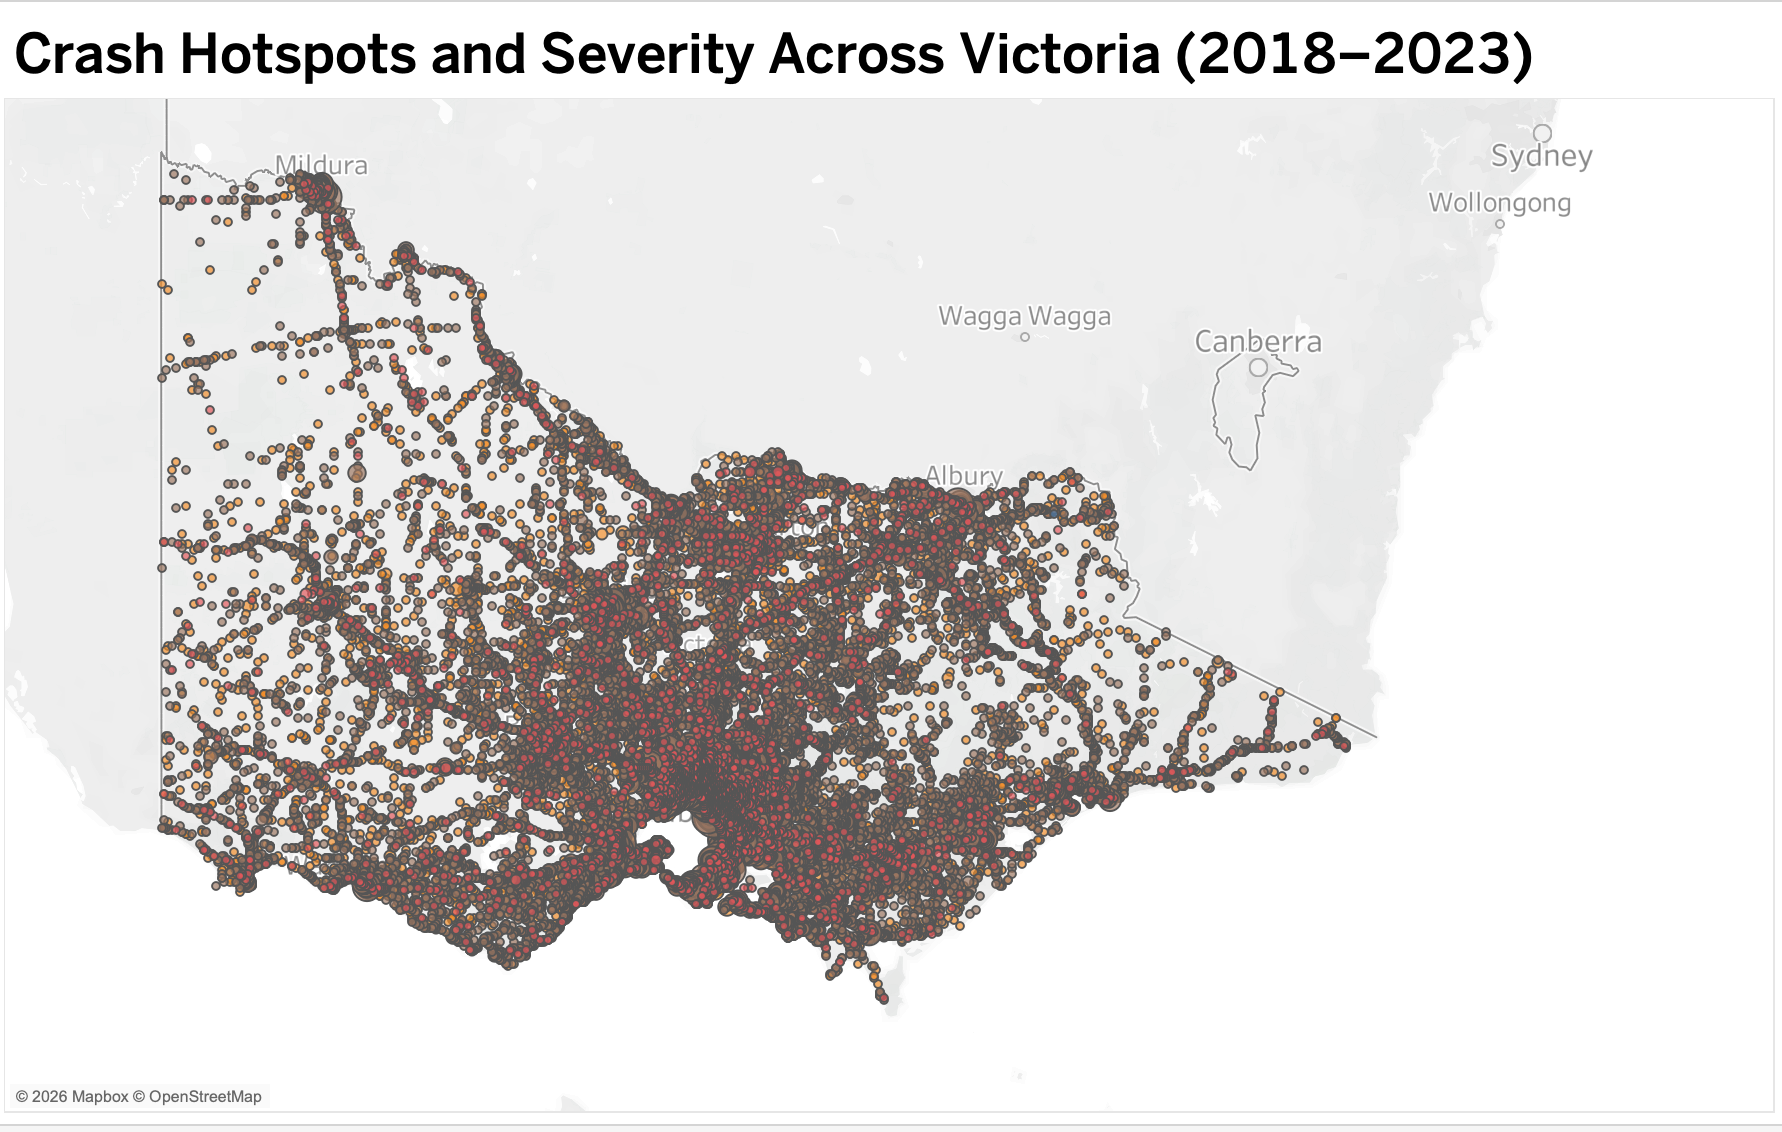
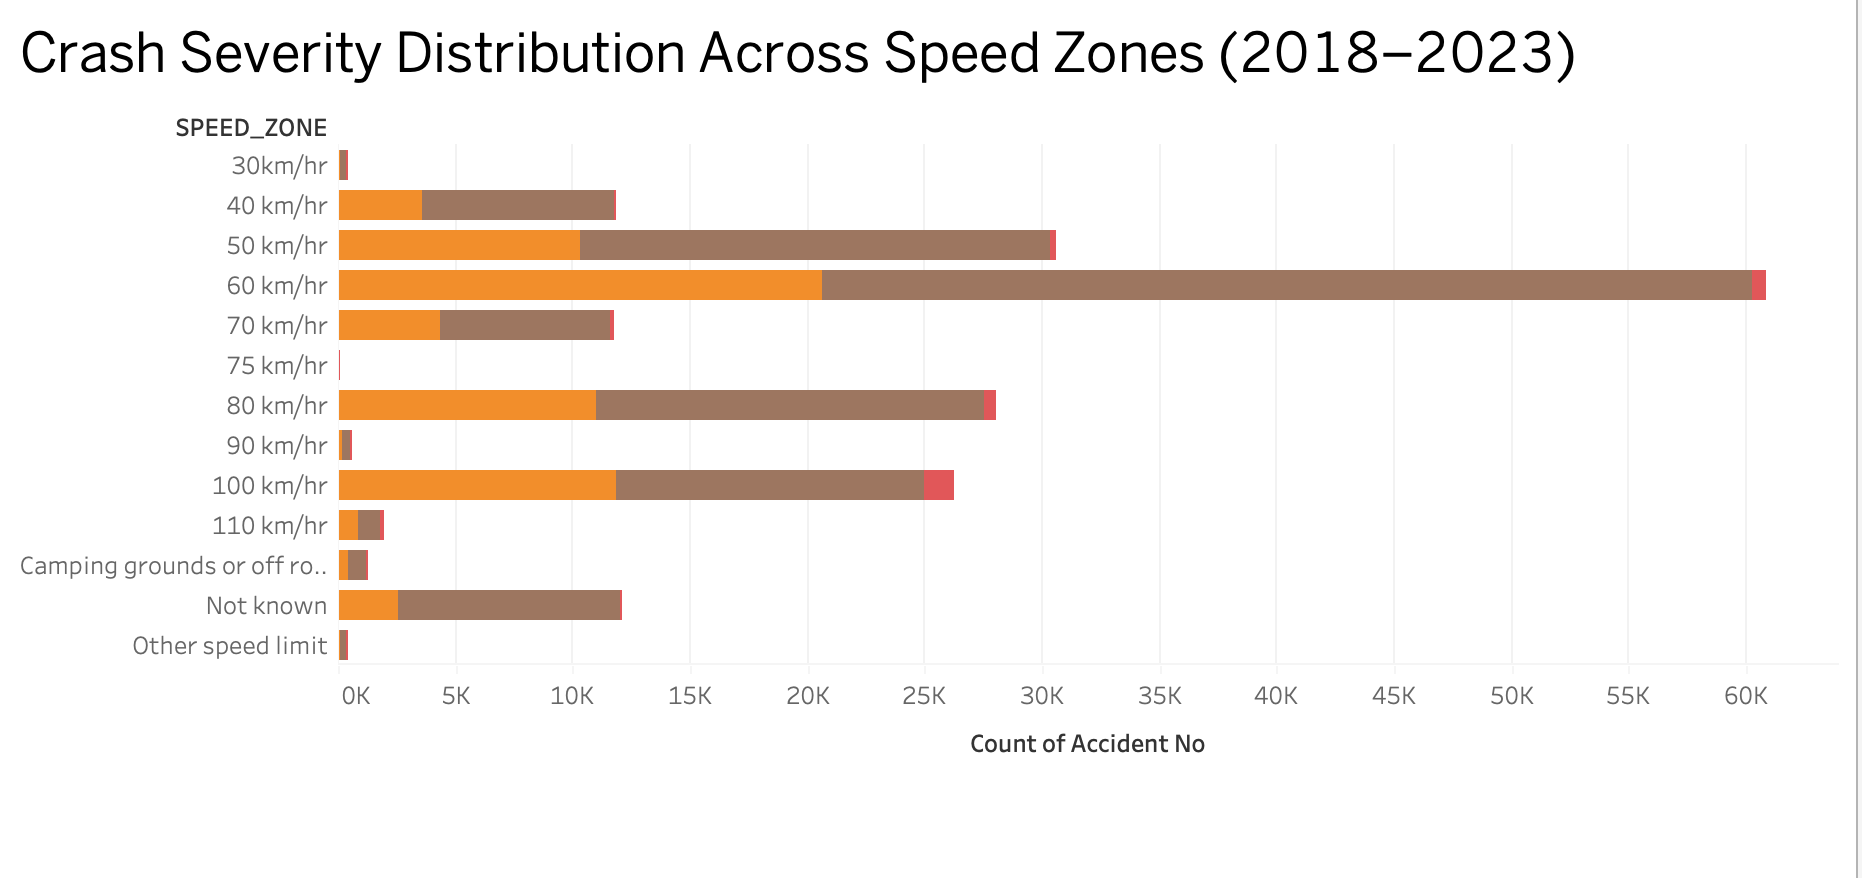
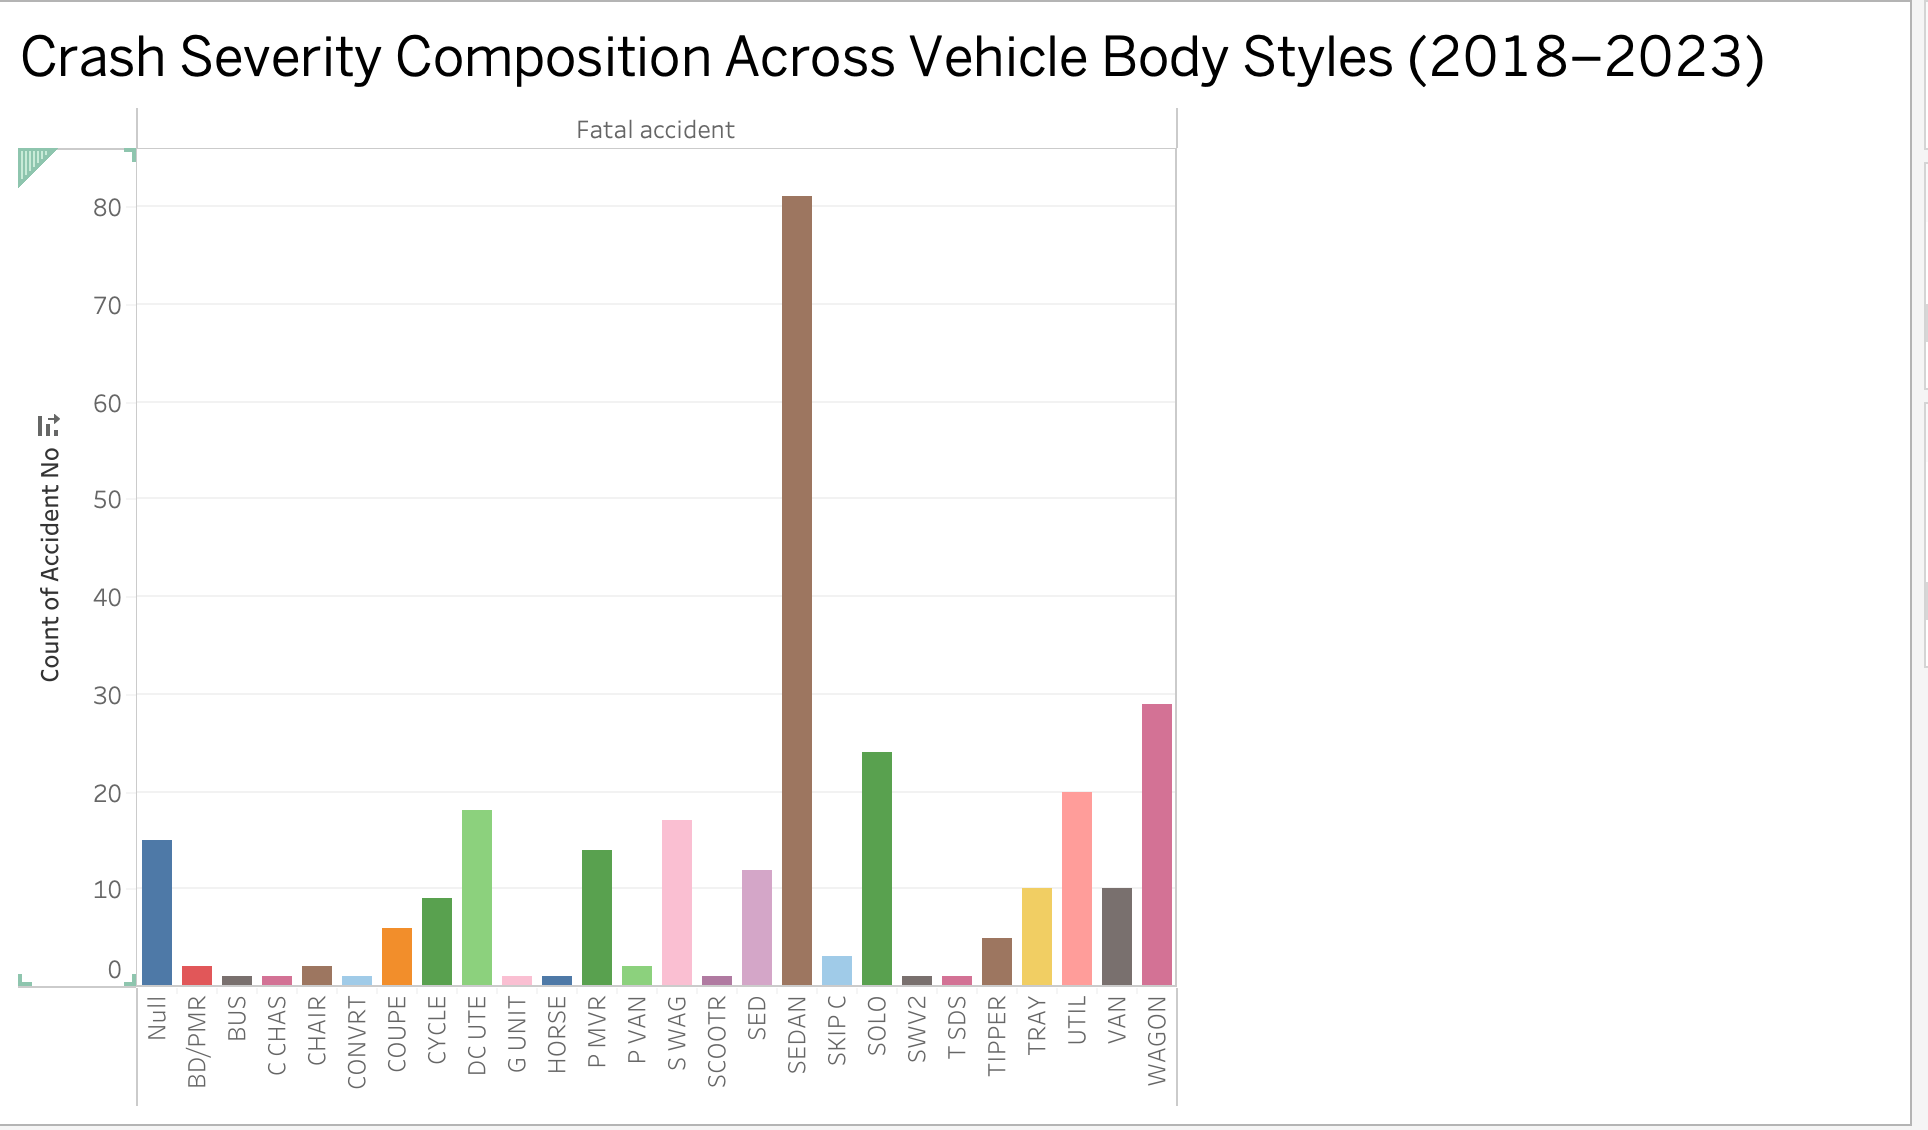
Built a Tableau dashboard analysing 5 years of Victorian road crash records (2018 2023), visualising hotspots, severity trends, and risk factors for road safety analysis.
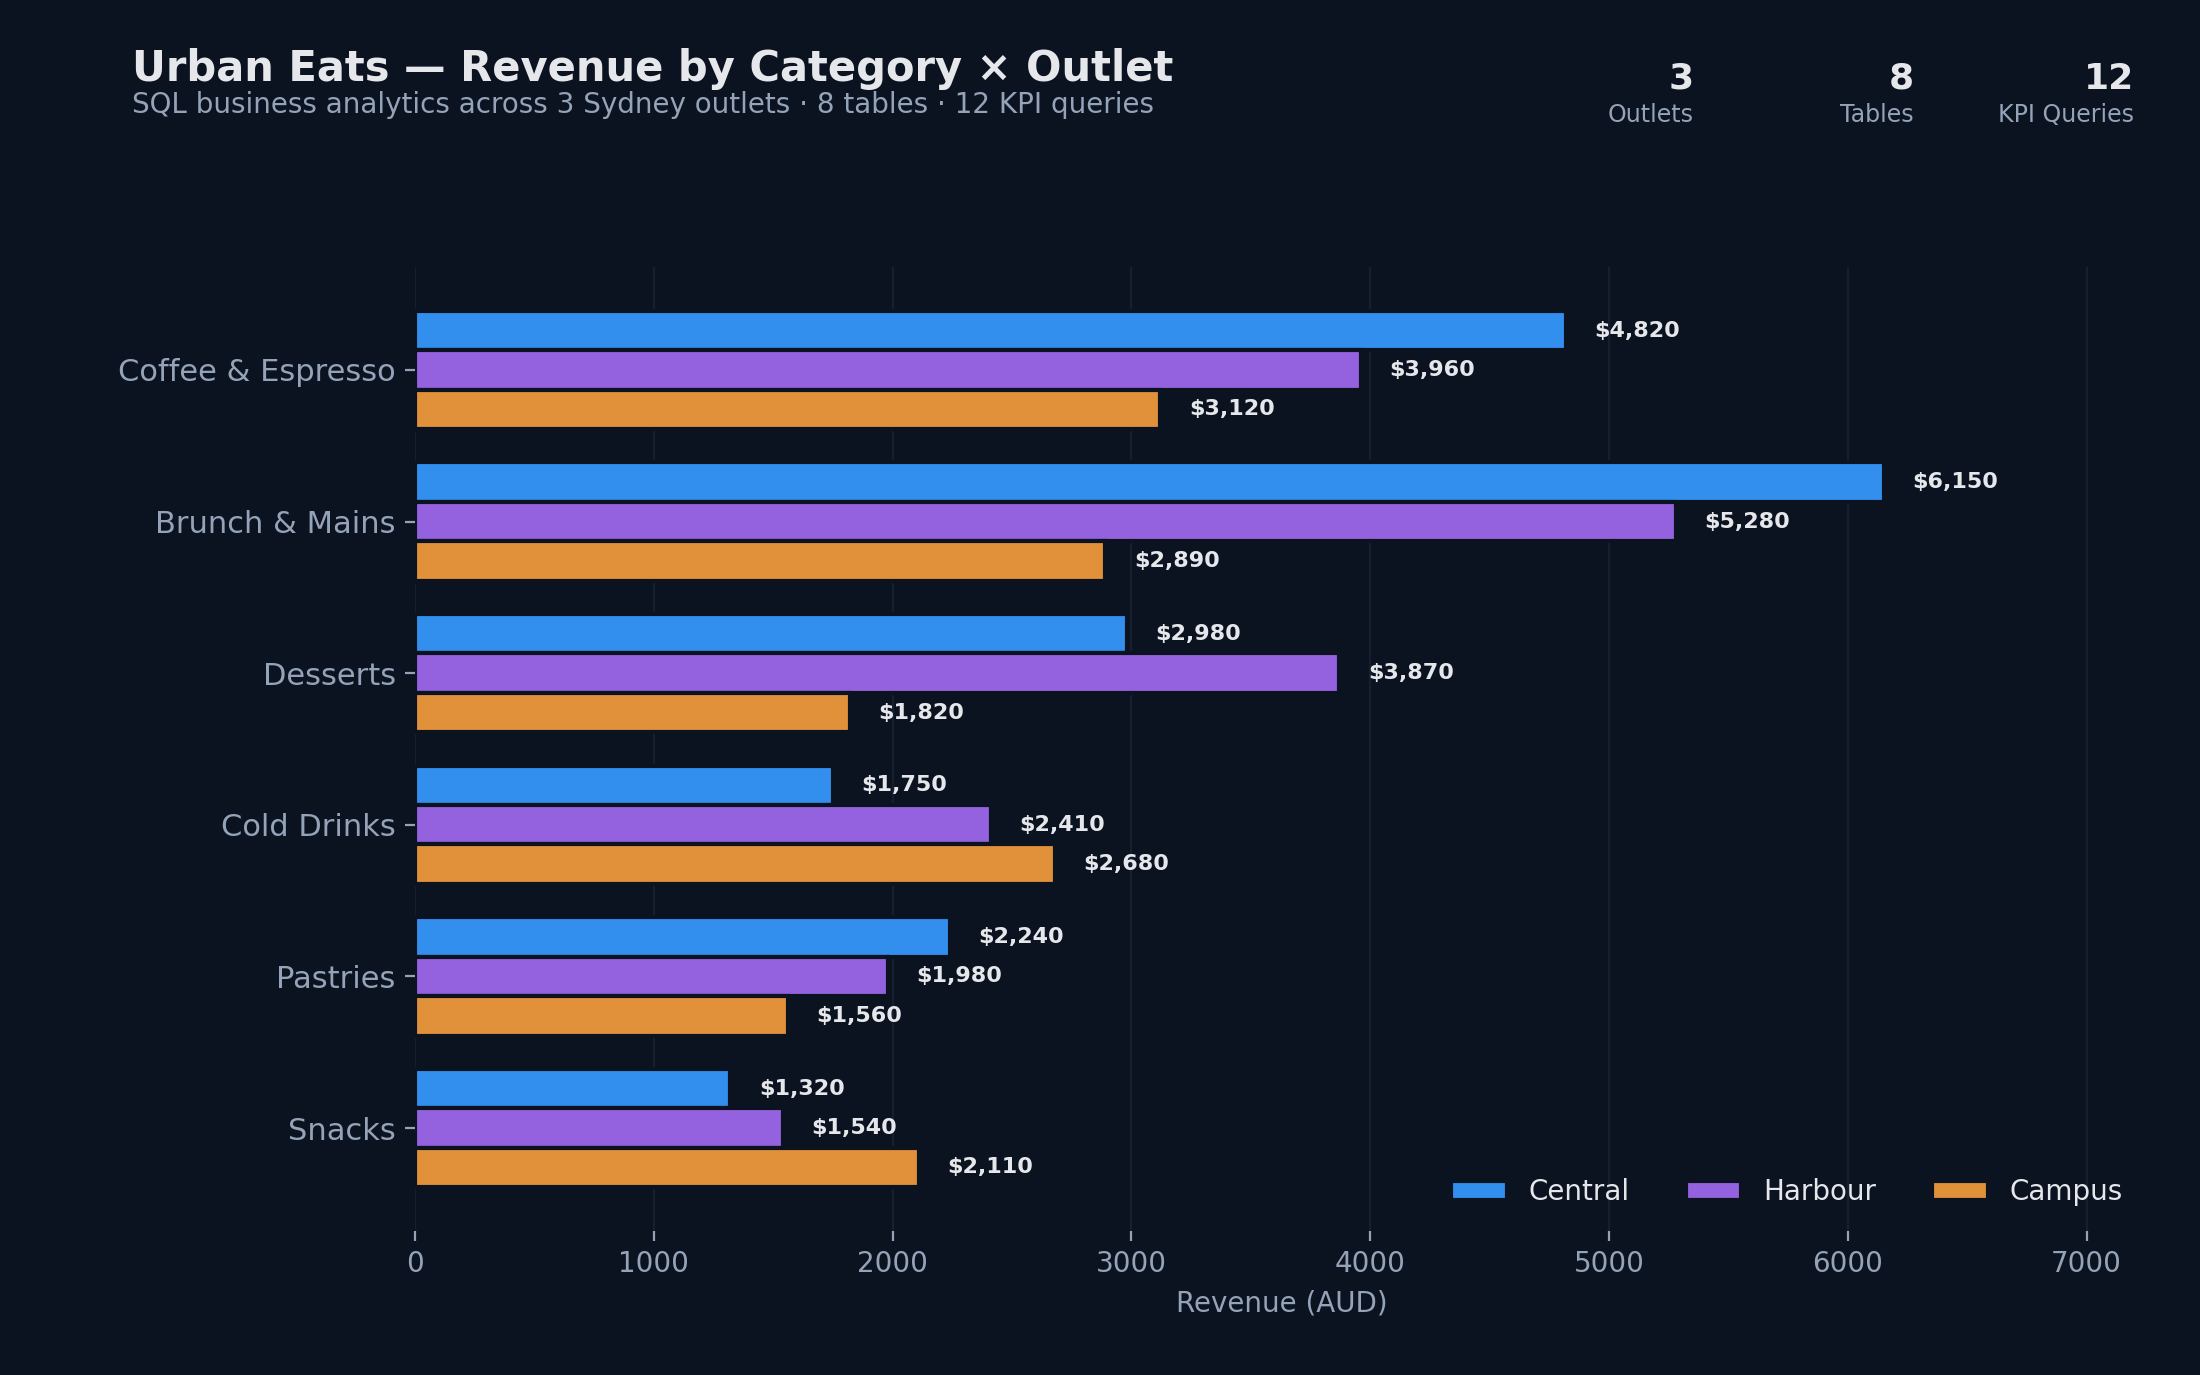
Designed relational database structures and wrote SQL queries to generate business insights and reporting for retail and café operations.
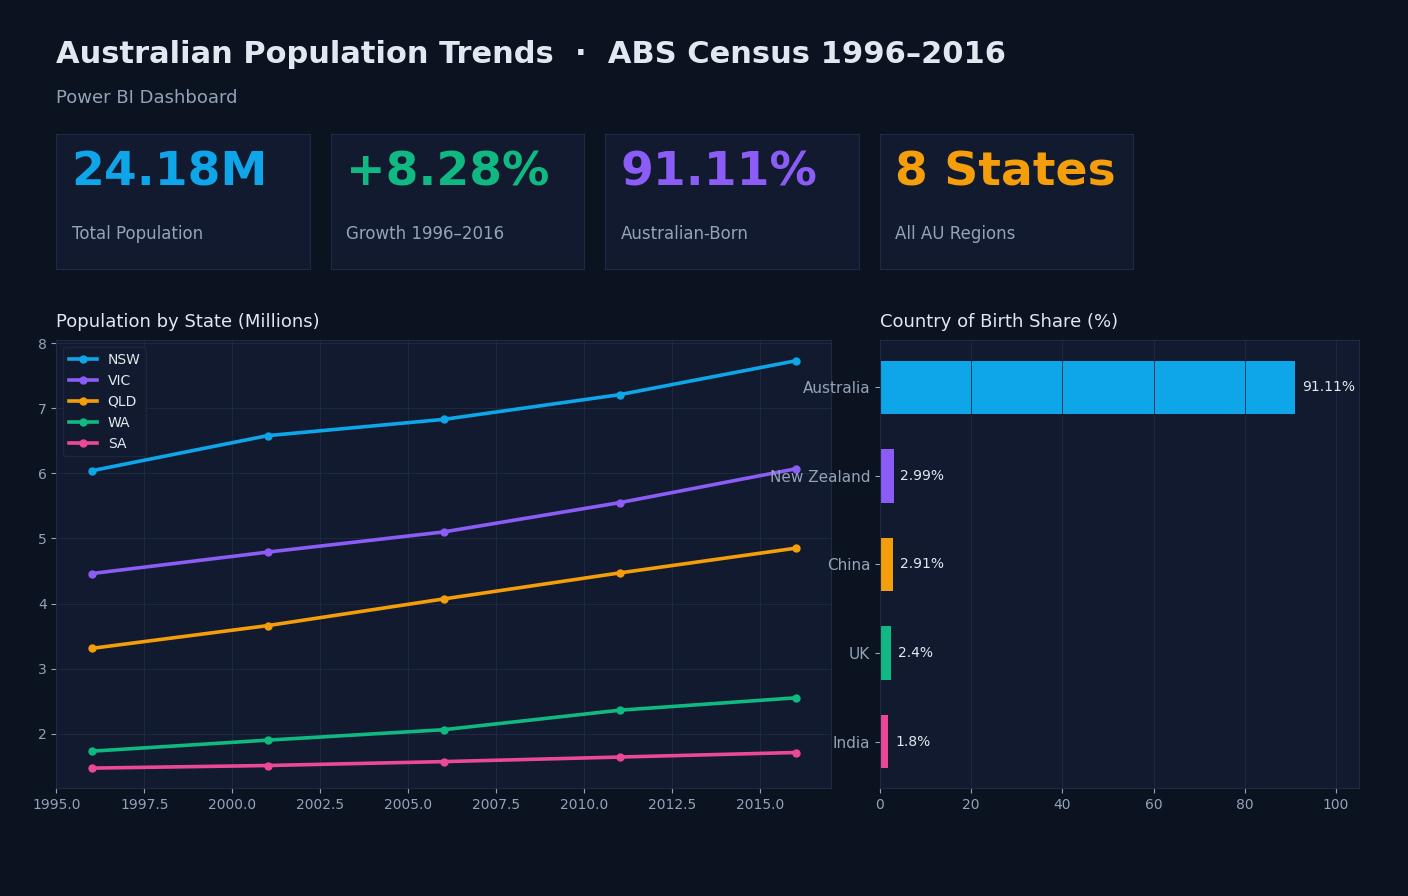
Built Power BI dashboards using ABS census data (1996 to 2016) to analyse Australia's population growth, age structure, gender split, and country of birth diversity across all states and territories, supporting planning for infrastructure, healthcare, and education. Found Australia reached 24.18M total population with 8.28% growth, driven primarily by NSW, VIC, and QLD, with 91.11% Australian born and strongest overseas born shares from New Zealand and China.
Applied machine learning, computer vision, and deep learning research.
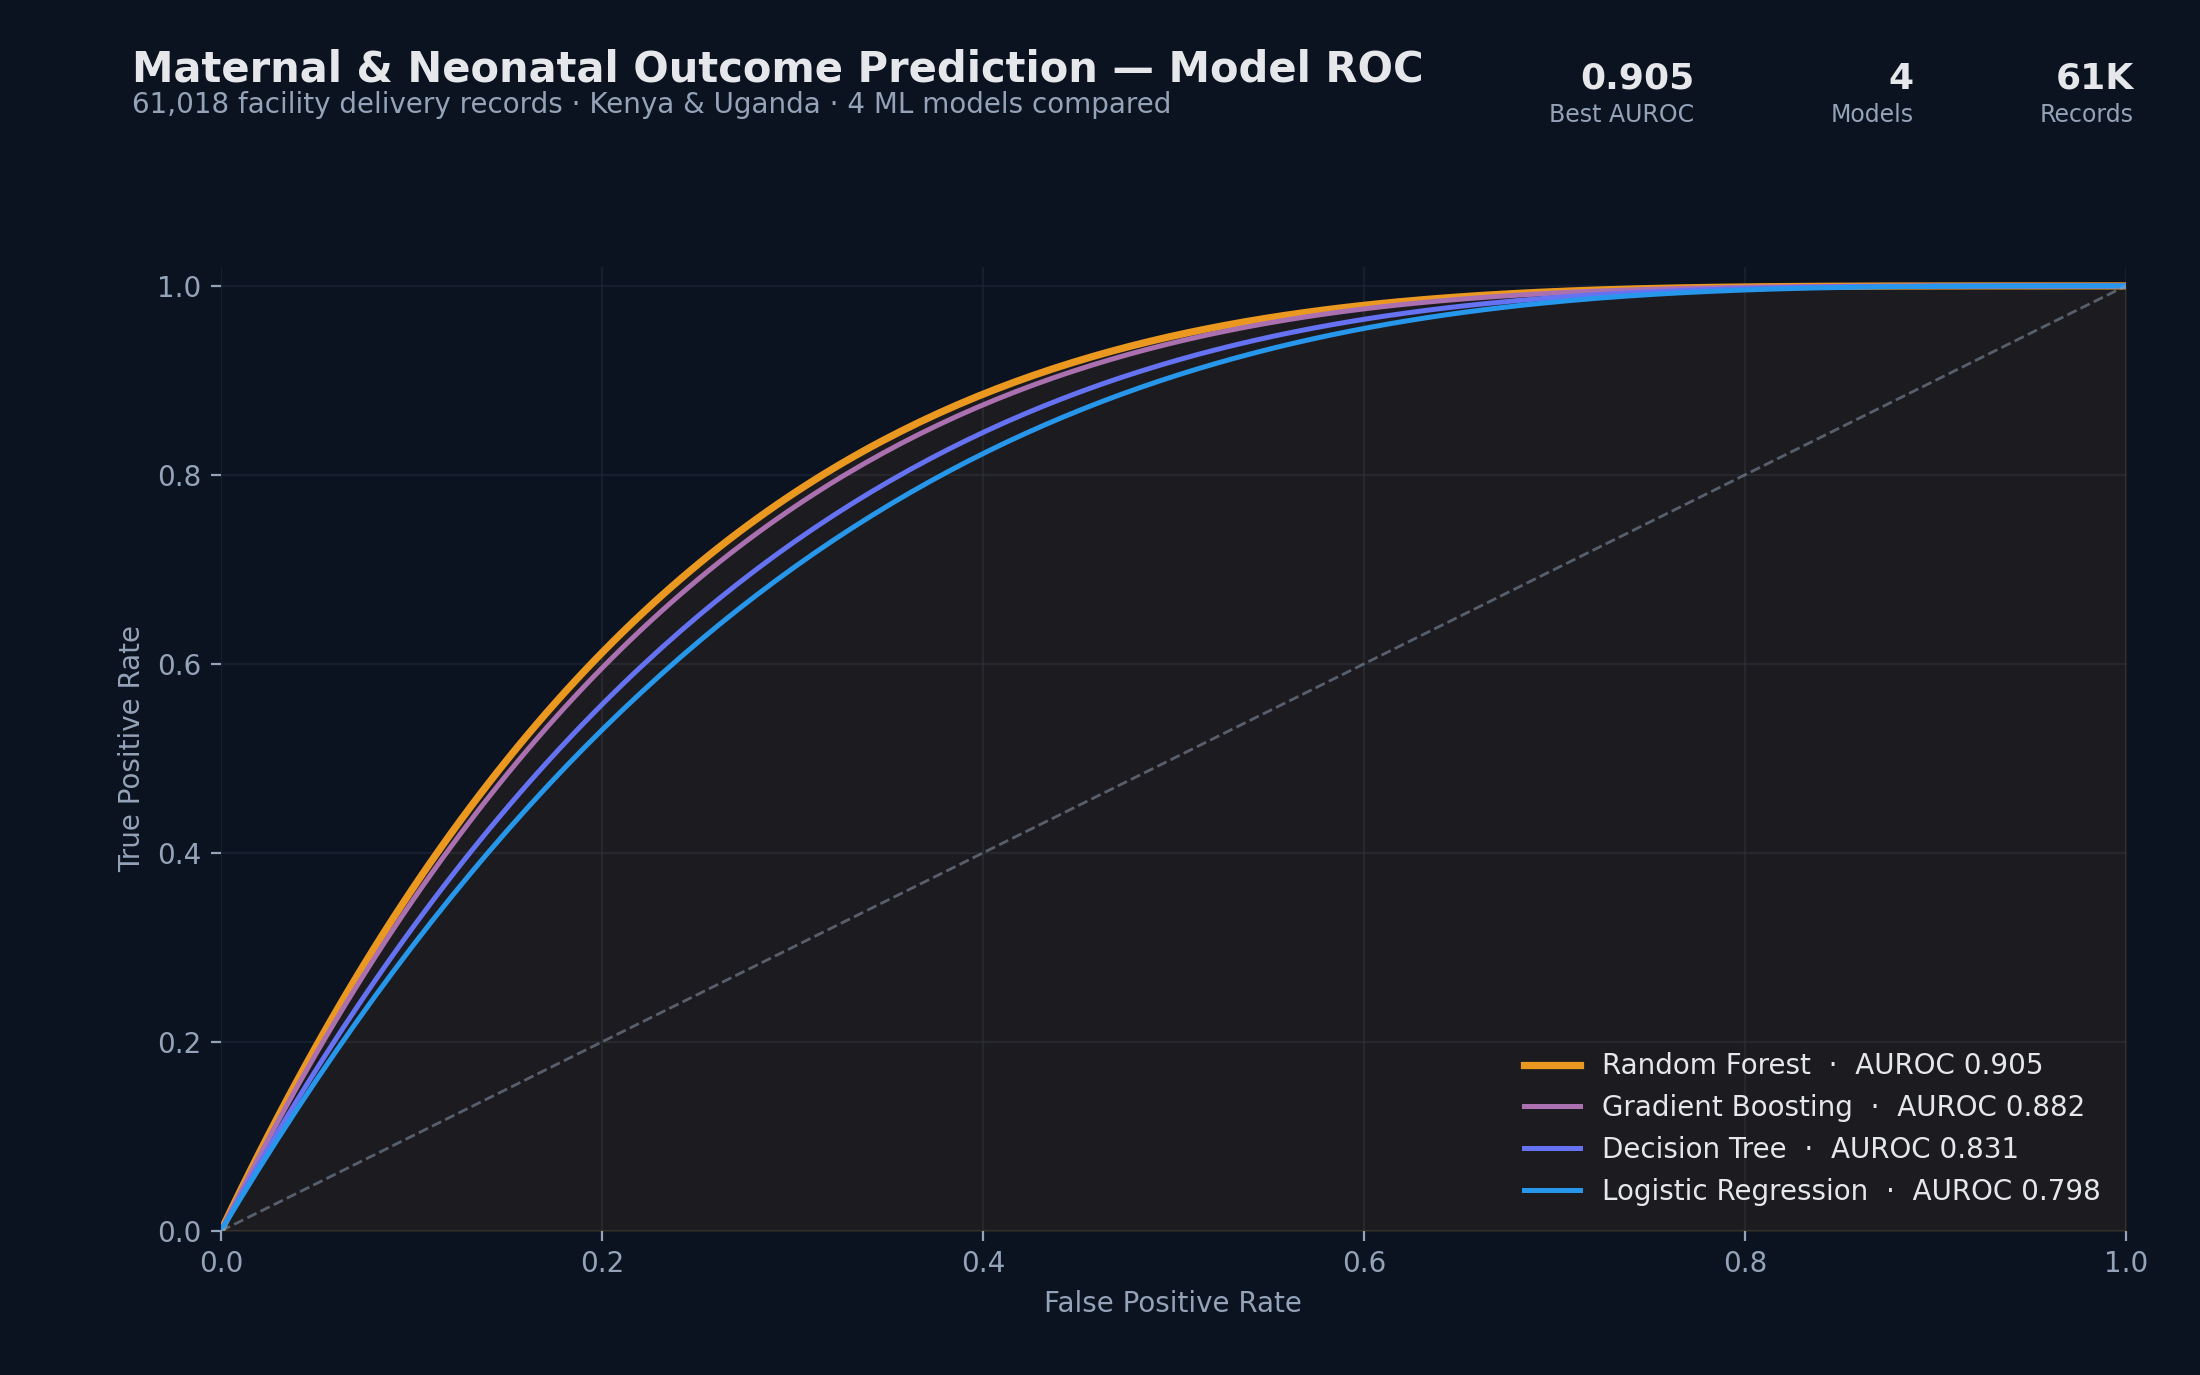
Predicted adverse maternal and neonatal birth outcomes using machine learning on 61,018 healthcare records from Kenya and Uganda. Compared multiple classification models including Random Forest, Decision Tree, KNN, and Logistic Regression to identify key risk factors and support data driven healthcare decision making.
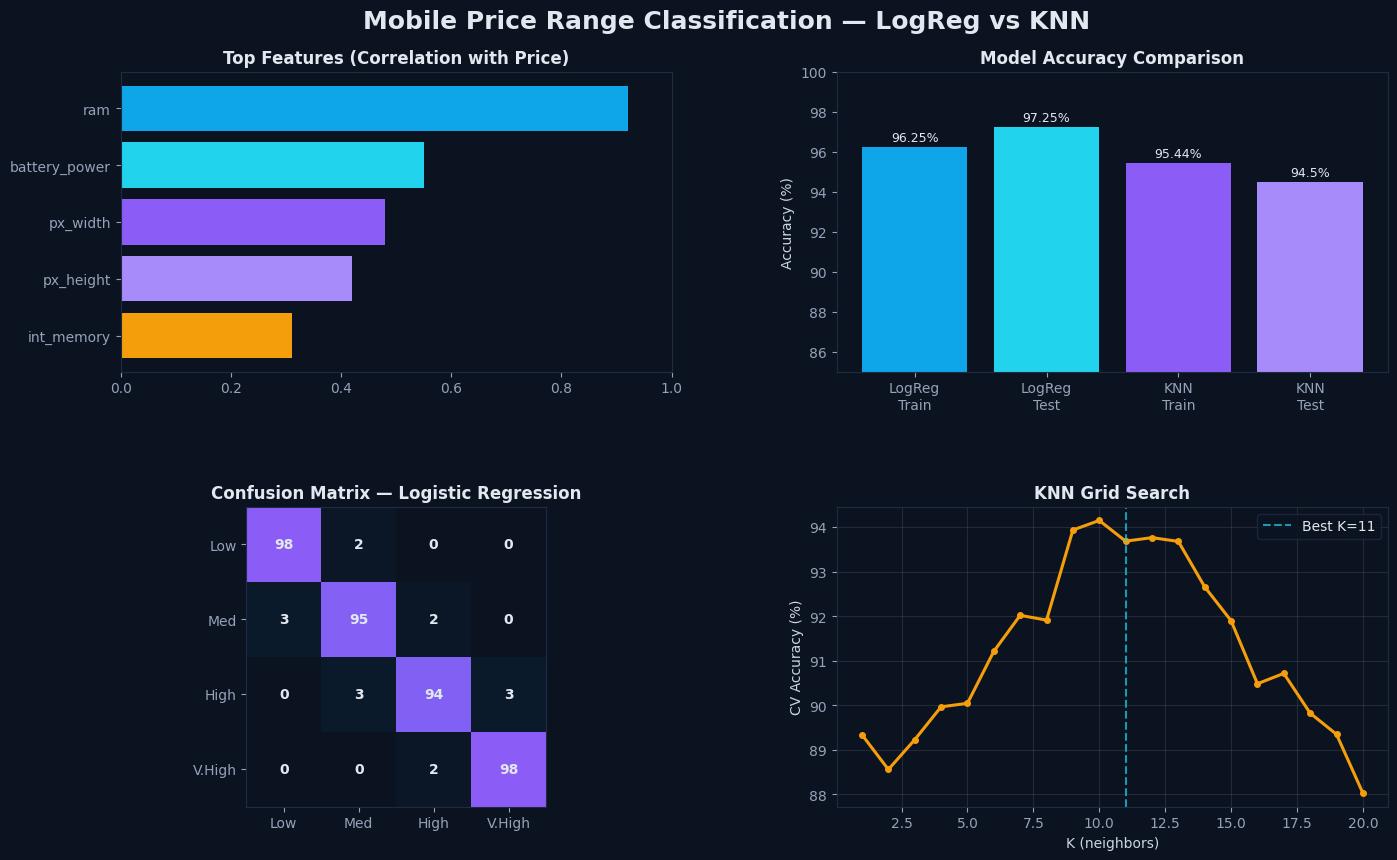
Built classification models on 2,000 mobile phone records with 20 hardware features (battery, RAM, camera, resolution, connectivity) to predict price range across 4 tiers: low, medium, high, very high. Compared Logistic Regression and K Nearest Neighbors with grid search hyperparameter tuning, identifying RAM, battery power, and display resolution as the strongest price drivers.
Team based business analytics and capstone projects, with my specific contributions highlighted on each card.
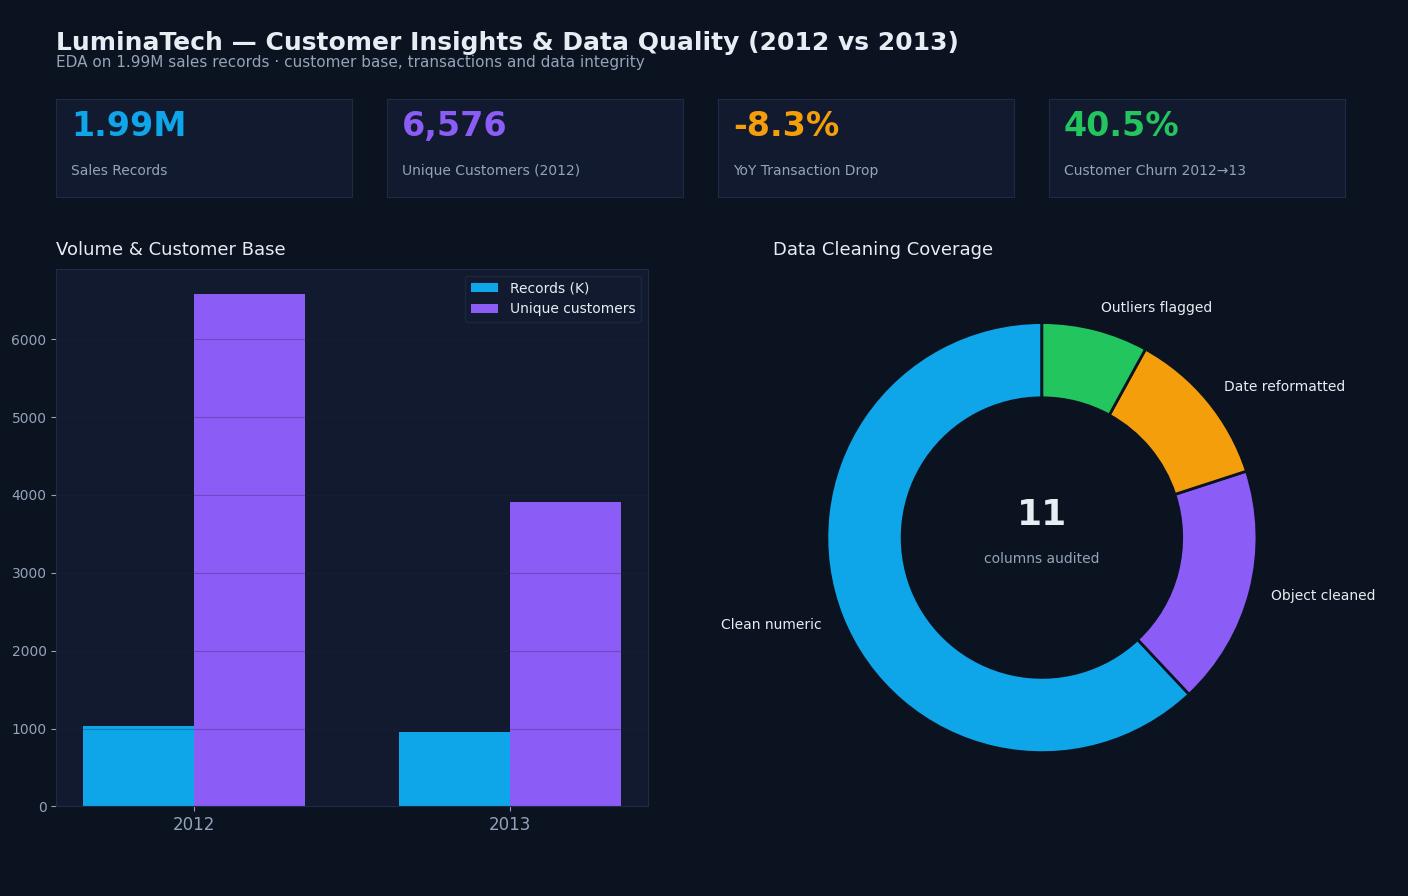
Built churn prediction models on 200,000 resampled records using Logistic Regression, KNN, Naive Bayes, and Random Forest. Random Forest identified recency and order frequency as the strongest churn signals.
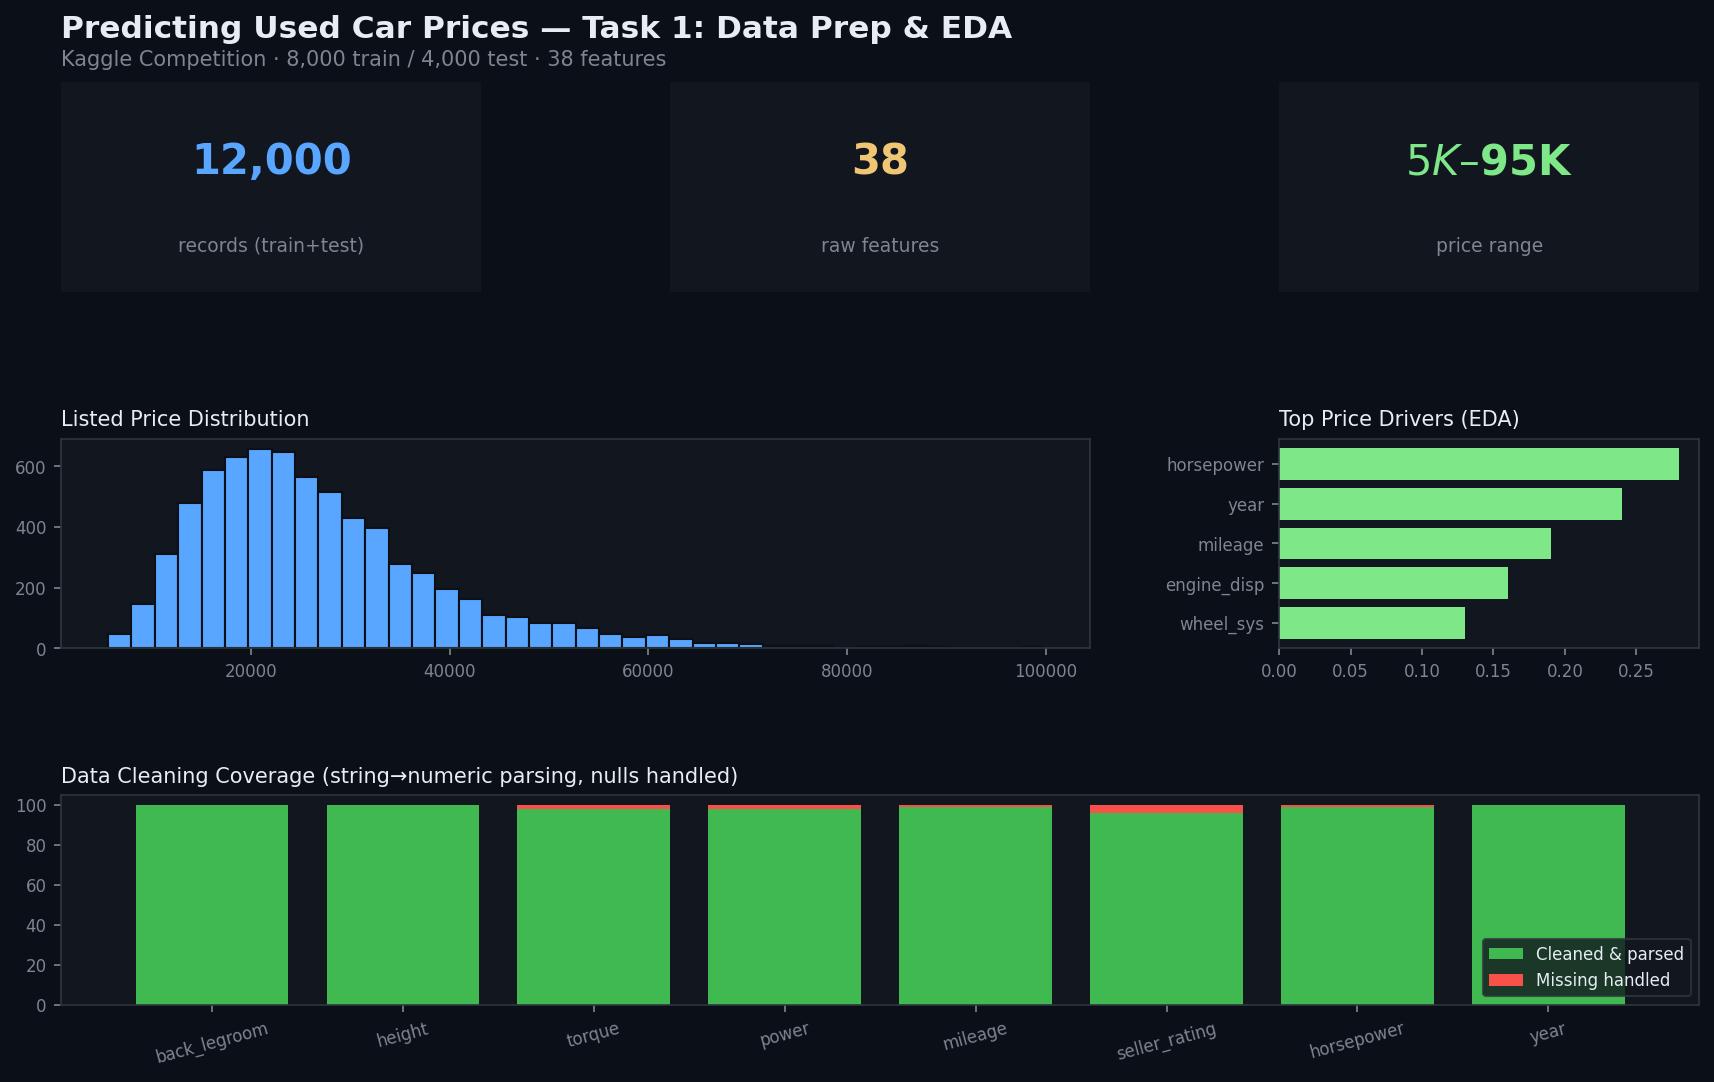
Team Kaggle competition predicting listed prices for ~12,000 used cars across 38 raw features (engine, drivetrain, dimensions, geography, listing metadata). The team trained and tuned regression models against a held out leaderboard; my workstream owned Task 1: turning the messy raw listings into a clean, model ready dataset and surfacing the price drivers the modelling team built on.
06: Experience
Jul 2026 to Present
Analysed a complex multi-table production database schema to reconstruct entity relationships and data flows. Mapped table-to-table relationships across functional domains to guide accurate query design and correct data joins. Authored PostgreSQL queries to answer business questions and translated results into Tableau dashboards with appropriate dimensions, measures, and aggregations. Assessed data completeness across key metrics using structured JOIN-based testing to detect and quantify gaps before they reached reporting dashboards.
Jan 2023 to Dec 2023 · Full time
Built and evaluated YOLOv5 and Detectron2 object detection models on a 968-image UAV dataset, achieving AP50 of 79.94. Contributed to a peer-reviewed manuscript submitted to Expert Systems with Applications.
07: Contact
If you are a recruiter or hiring manager working on Data Scientist roles in Sydney (or remote), I would welcome a conversation. Reach me at md.nafis08@gmail.com or connect on LinkedIn.