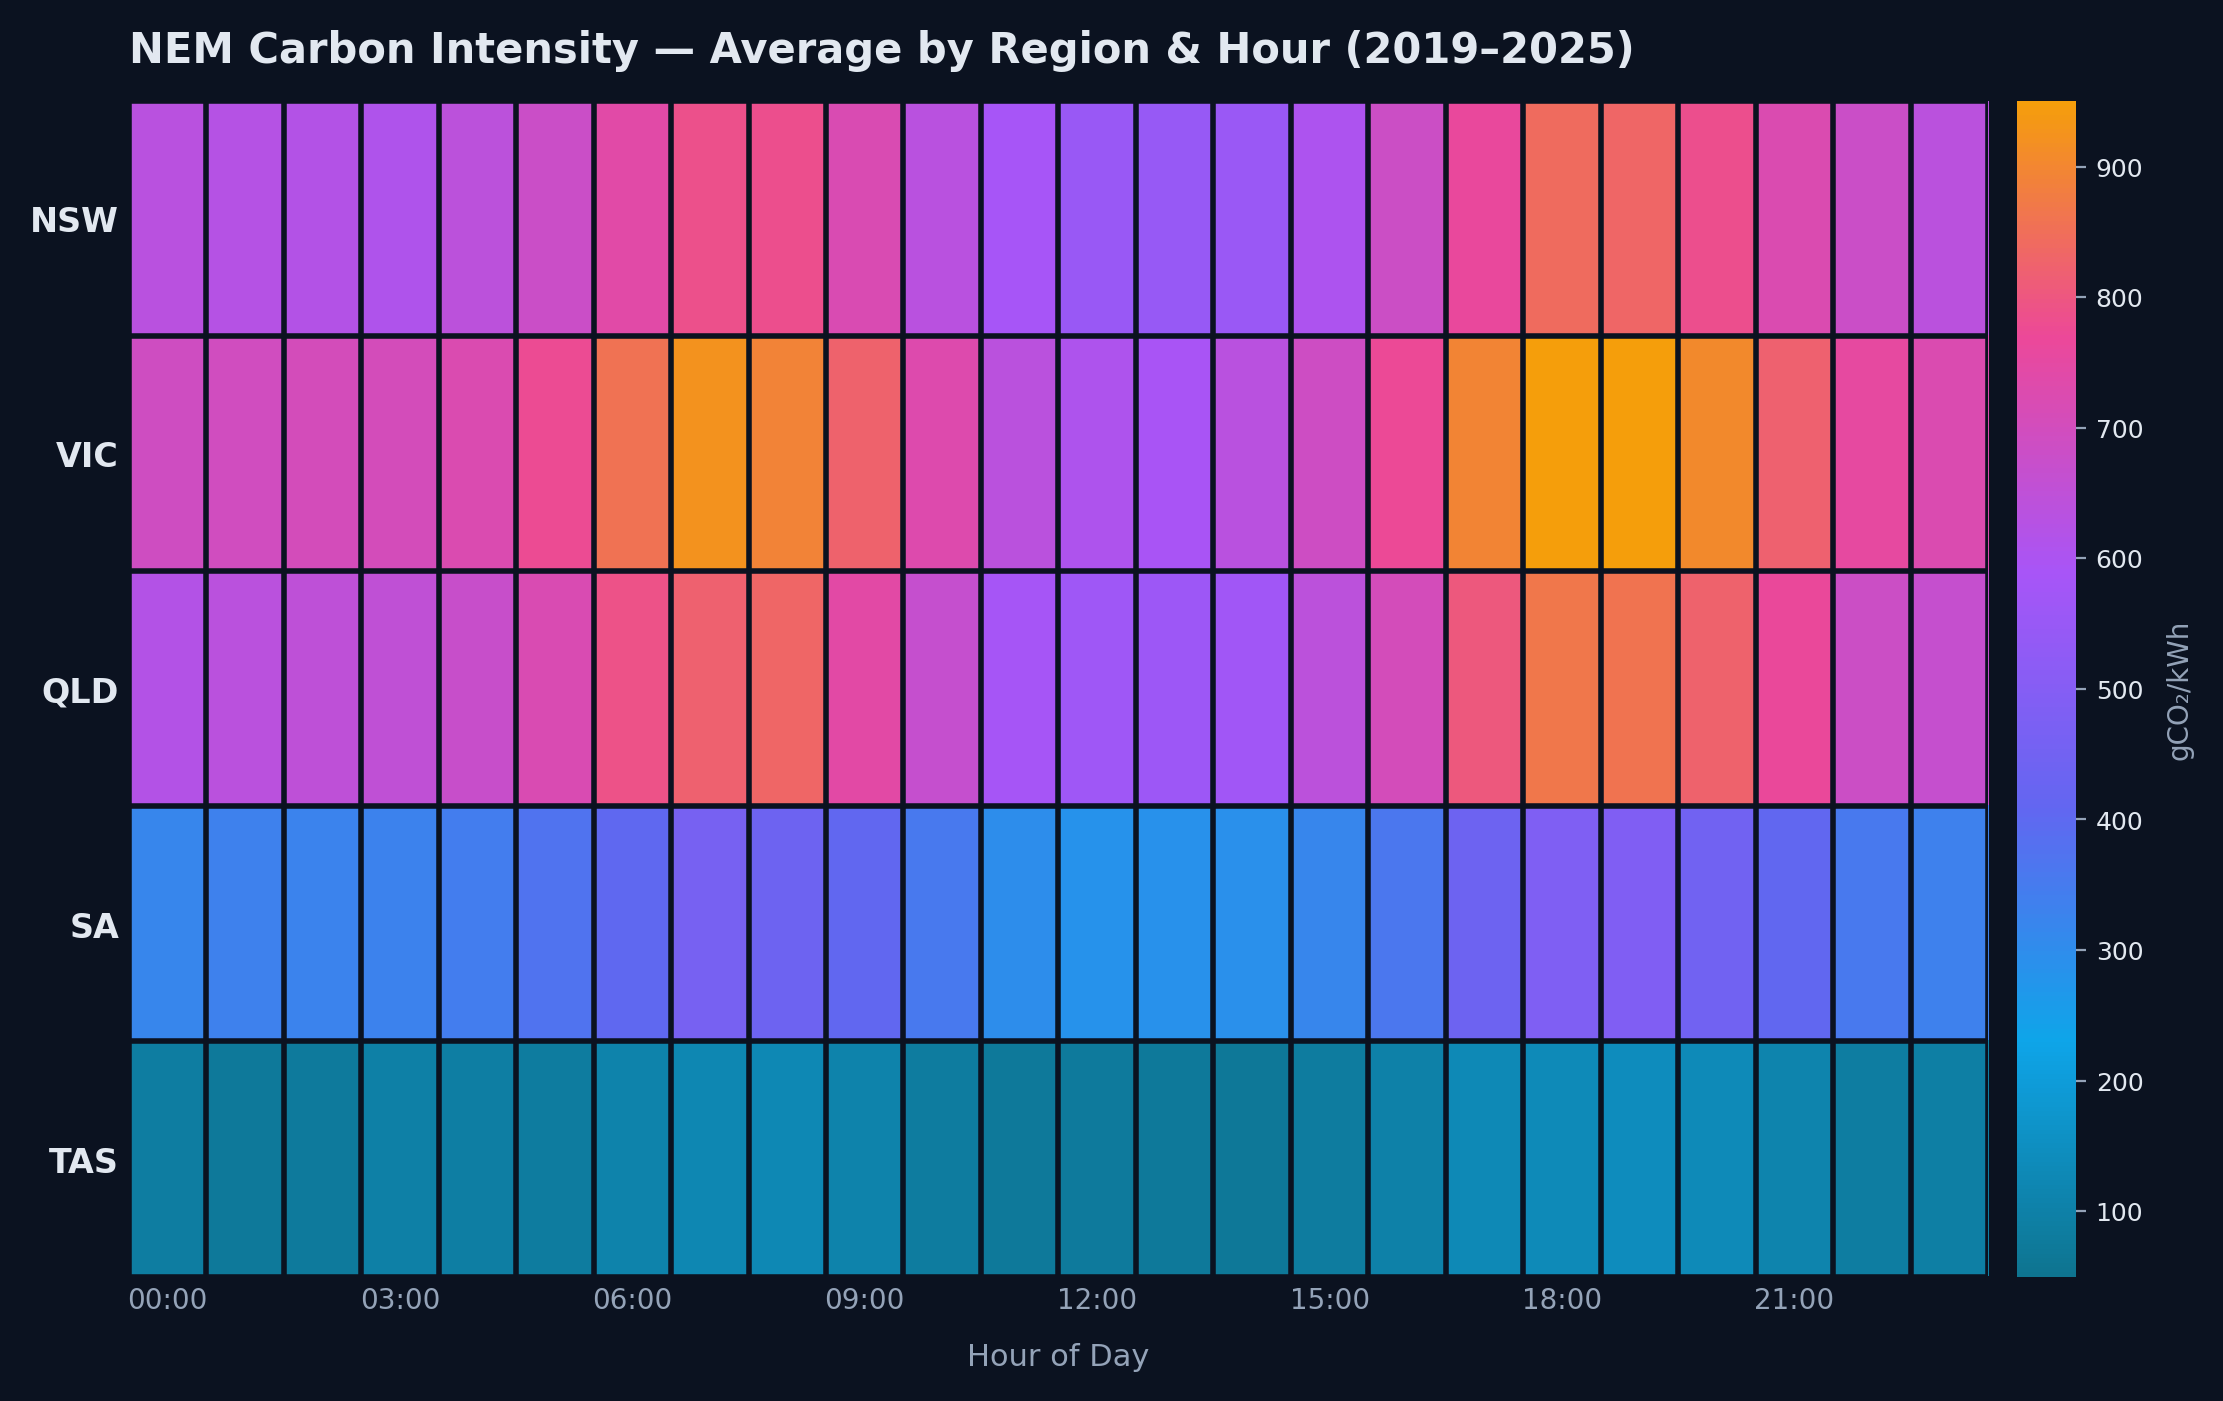
Available immediately · Sydney + remote worldwide

Muntasir Md Nafis

Junior Data Analyst / Data Scientist · Sydney based · Open to remote

I like the messy part: taking chaotic data and making it undeniable.

Graduate Temporary Visa (subclass 485) · Full unrestricted working rights in Australia

01: About

Bridging code, statistics, and business decisions.

I started in Computer Science and fell in love with the stories hiding in raw numbers. A Master of Business Analytics at Macquarie taught me to bridge rigorous code and statistics with the clarity stakeholders need. Now I'm looking for junior Data Analyst, Data Scientist, or Business Analyst roles where I can build end to end pipelines, ship dashboards that get used, and implement machine learning models that drive real impact.

Master of Business Analytics

Macquarie University

Machine Learning

Classification · Forecasting

Data Visualisation

Power BI · Tableau

SQL & Analytics

End to end pipelines

02: Journey

From Dhaka to Sydney

A decade of learning, research, moving countries, and building toward a career in data.

2018 to 2022

Bachelor of Science in Computer Science and Engineering

North South University, Dhaka, Bangladesh. Built a foundation in algorithms, software engineering, and research methods.

2023

Research Assistant, Machine Learning and Computer Vision

North South University. Prepared datasets, trained models, and evaluated object detection pipelines using YOLOv5 and Detectron2.

2024

Moved to Sydney, started Master of Business Analytics

Macquarie University, North Ryde, Australia. Bridged technical depth with business storytelling, stakeholder communication, and decision science.

2025

Runner up, Business Analytics Capstone Competition

Macquarie University. Recognised for analytical rigour and delivering business impact under tight deadlines.

2026

Launched mmnanalytics.com, open to new roles

Building a public portfolio and actively looking for Data Analyst and Data Scientist opportunities where I can drive real impact.

03: Skills

Tools & Technologies

Technologies and techniques I use regularly, grouped by domain.

Core

PythonSQLPandasNumPyScikit-learnMatplotlibJupyterGitExcel

Visualisation & BI

Power BITableauSeabornDAX

Analytics

EDAFeature EngineeringClassificationRegressionTime Series ForecastingStatistical Analysis

Database

MySQLSQLiteERD DesignRelational Modelling

04: Education

Academic background

Master of Business Analytics

Macquarie University· North Ryde, NSW
Feb 2024 to Jan 2026

Achievements: 2nd Place: Business Analytics Capstone Project Competition (2025)

Bachelor of Science in Computer Science and Engineering

North South University· Dhaka, Bangladesh
Jan 2018 to Dec 2022

Achievements: Cum Laude Distinction

05: Projects

Analytics, BI & machine learning work

Real world projects across forecasting, predictive analytics, business intelligence dashboards, SQL, and applied machine learning research.

Featured Analytics Projects

Forecasting, predictive analytics, and exploratory business analysis.

03 projects
NEM Carbon Emissions Analytics (2019 to 2025) previewNEM Carbon Emissions Analytics (2019 to 2025) preview slide 1NEM Carbon Emissions Analytics (2019 to 2025) preview slide 2NEM Carbon Emissions Analytics (2019 to 2025) preview slide 3NEM Carbon Emissions Analytics (2019 to 2025) preview slide 4NEM Carbon Emissions Analytics (2019 to 2025) preview slide 5
6 Years of Data

NEM Carbon Emissions Analytics (2019 to 2025)

PythonPandasTime Series AnalysisData VisualisationMatplotlibCSIRO Emissions API
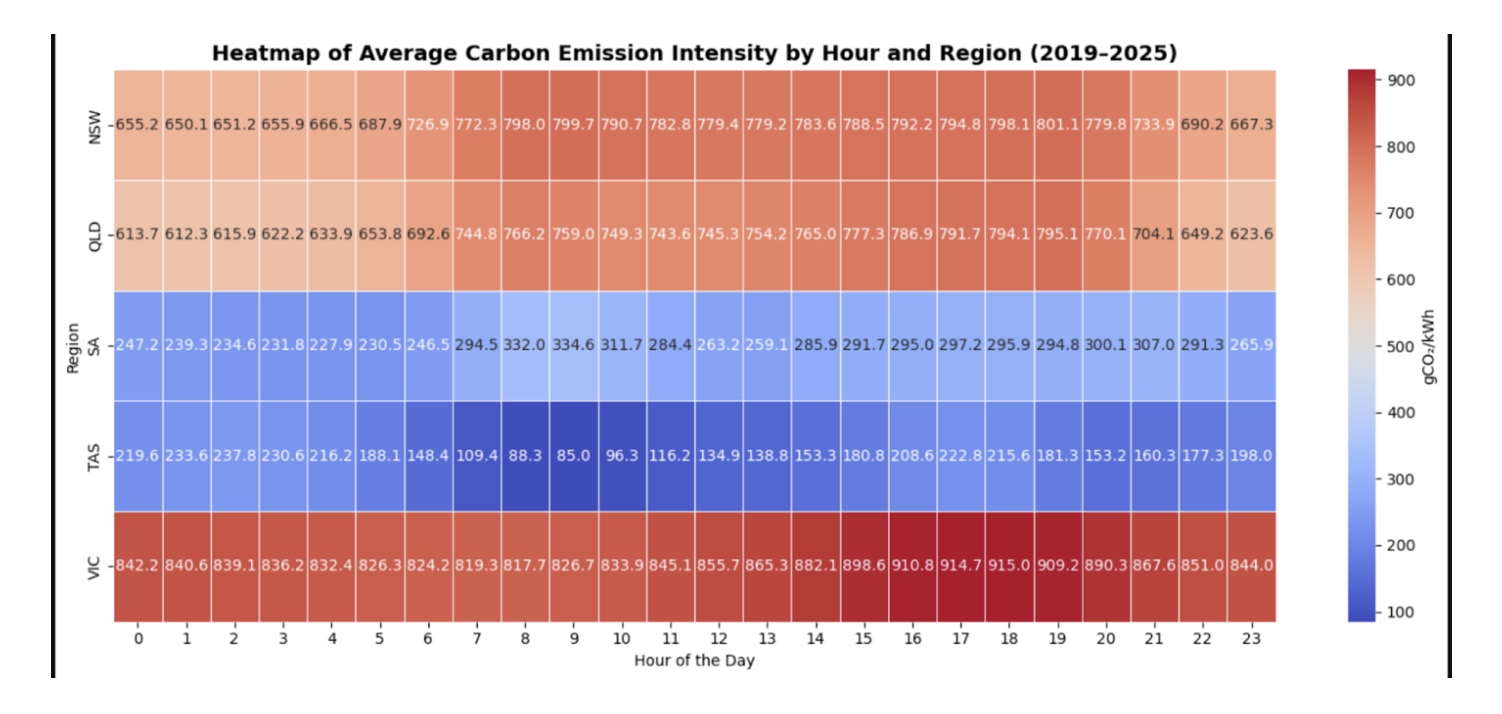
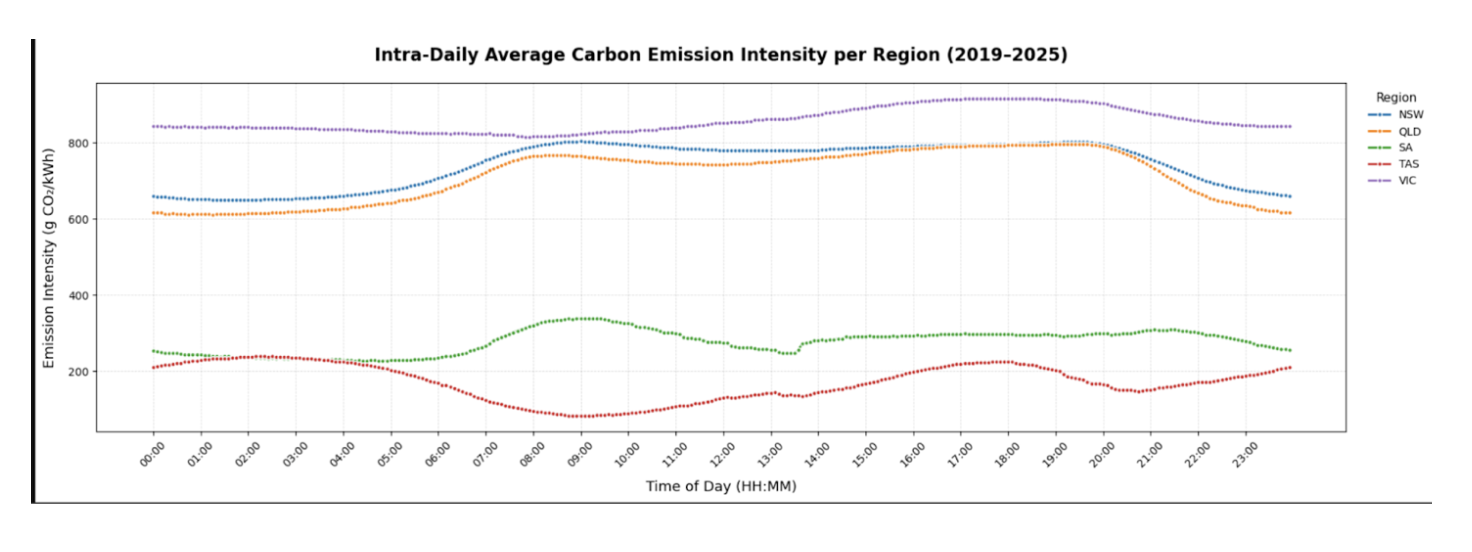
900+gCO₂/kWh peak detected in VIC evening windows

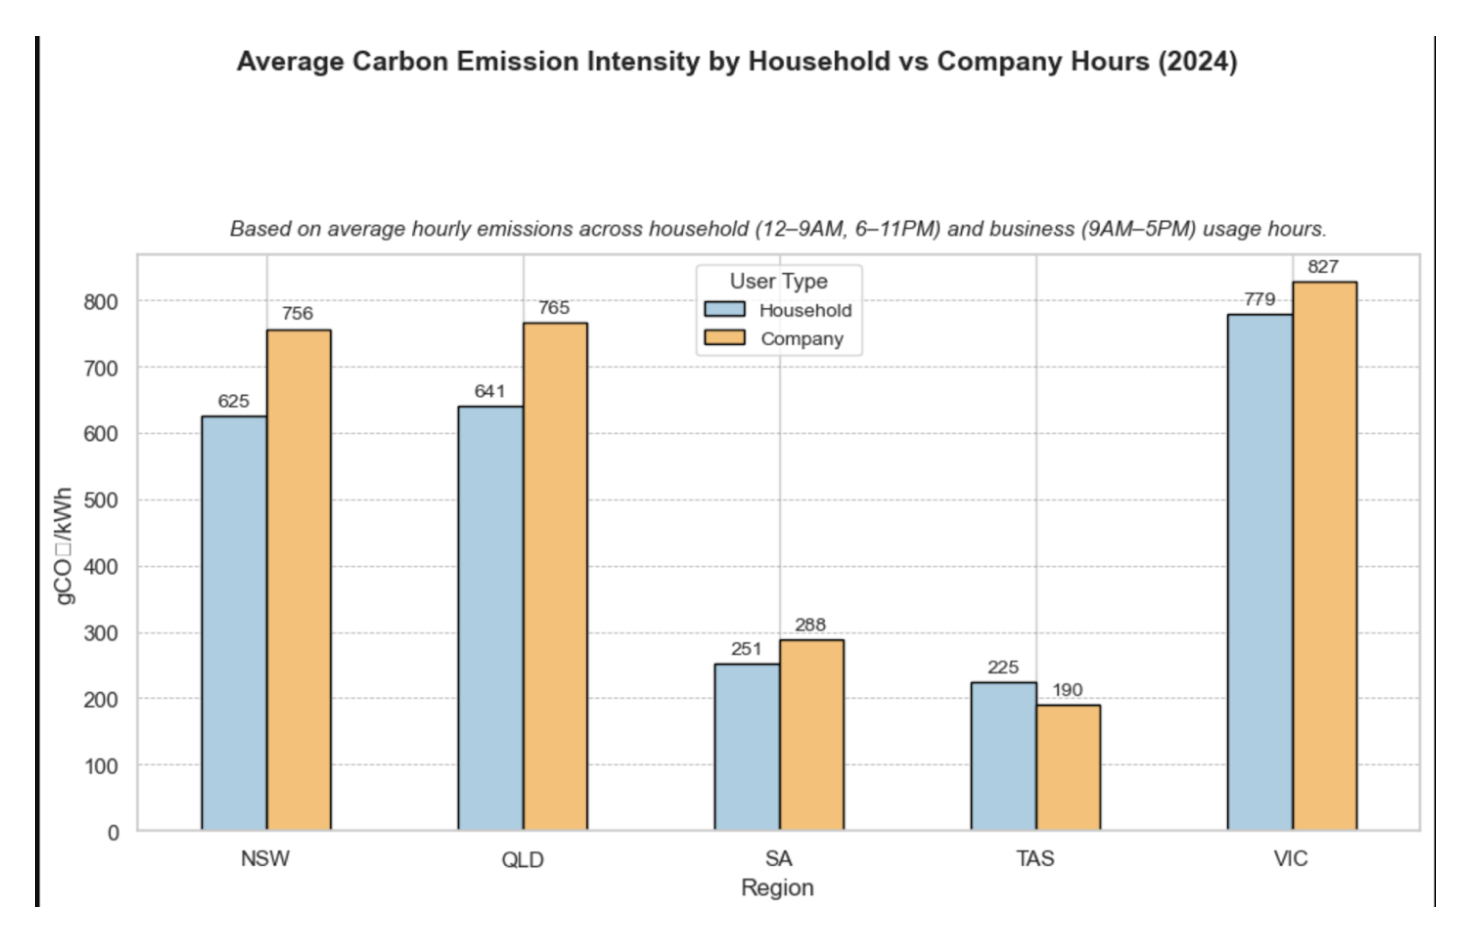
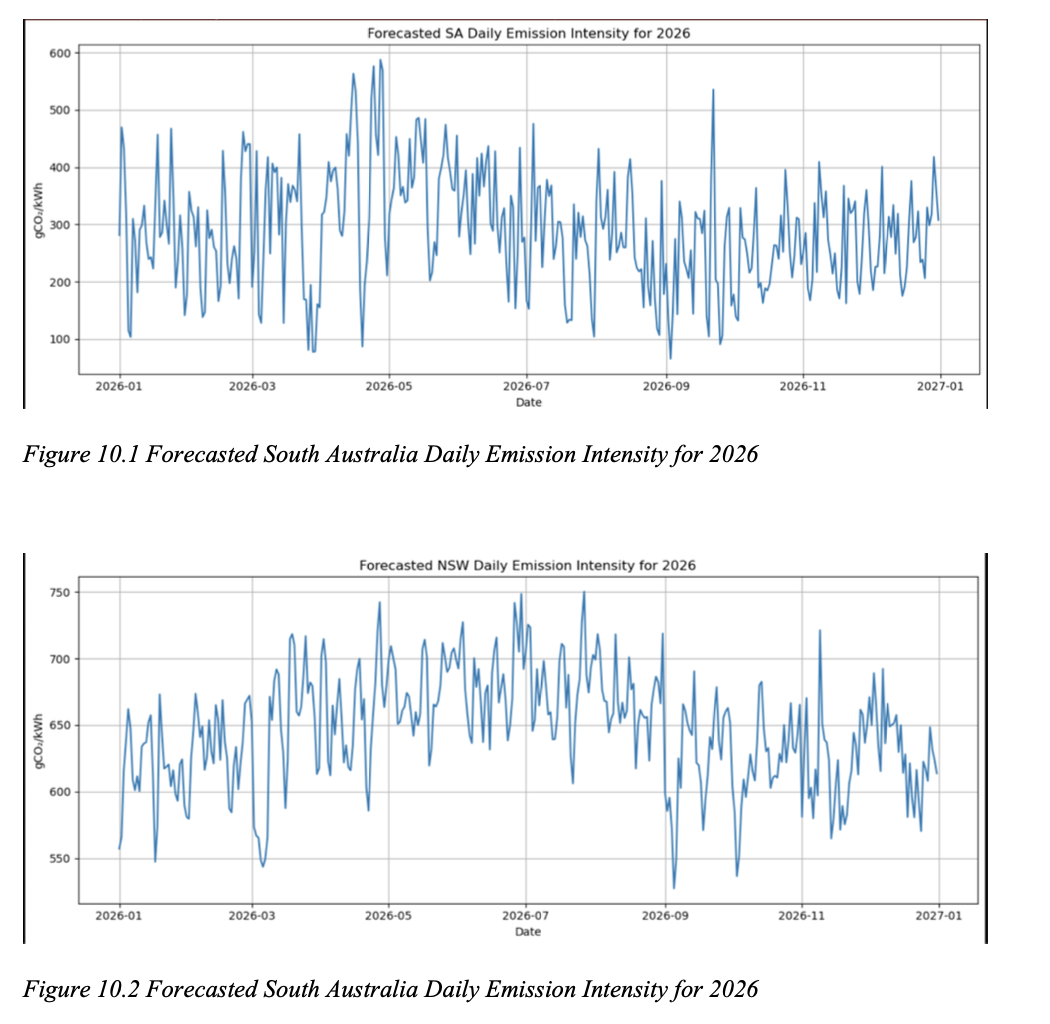
Analysed six years of Australian National Electricity Market carbon emission intensity data across NSW, VIC, QLD, SA, and TAS to identify high emission peak periods, low emission usage windows, and regional emission drivers.

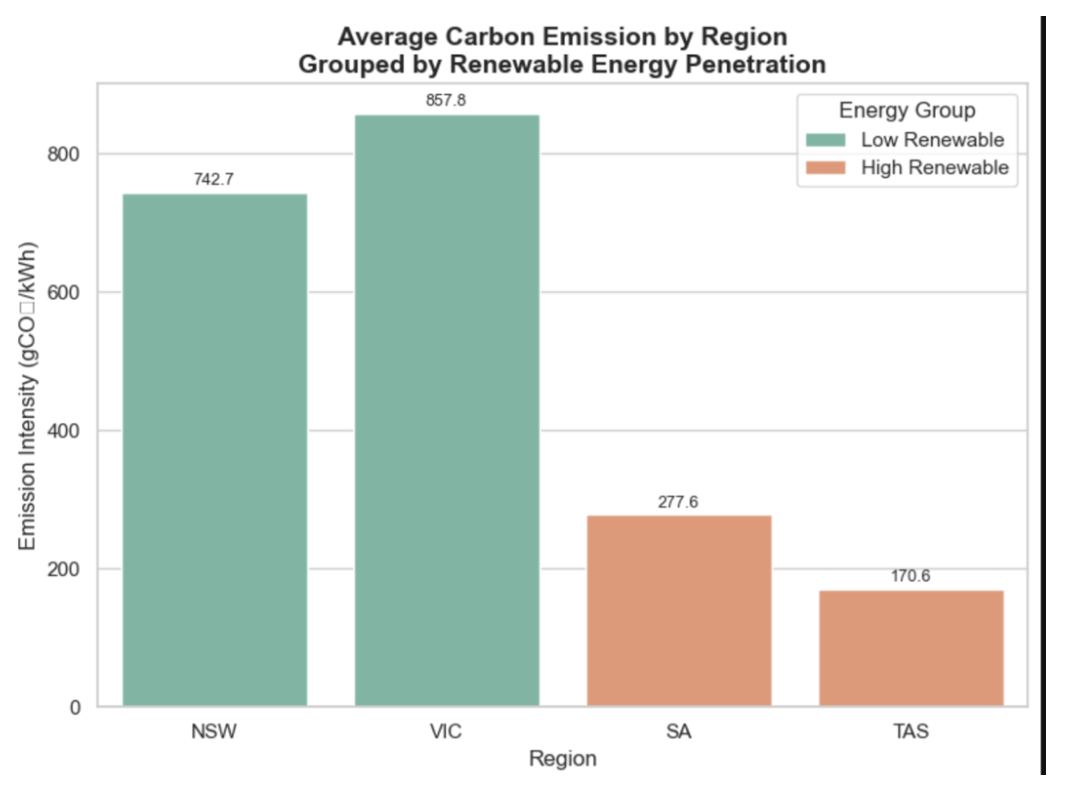
5 Australian RegionsVIC 31% Emission Share900+ gCO₂/kWh PeakTime Series AnalysisRegional Heatmaps
Dead Stock Prediction Using Machine Learning preview
3,000 Inventory Records

Dead Stock Prediction Using Machine Learning

PythonPandasNumPyScikit-learnMatplotlibJupyter Notebook
3,000inventory records modelled for stockout risk

Built an end to end predictive analytics workflow using 3,000 inventory records to identify products at risk of becoming dead stock across stock ageing, monthly demand, inventory turnover, ABC classification, and warehouse movement variables.

Logistic RegressionRandom ForestFeature EngineeringInventory Risk PredictionConfusion Matrix Evaluation
Dibs Retail Analysis (99K Transactions) previewDibs Retail Analysis (99K Transactions) preview slide 1Dibs Retail Analysis (99K Transactions) preview slide 2Dibs Retail Analysis (99K Transactions) preview slide 3Dibs Retail Analysis (99K Transactions) preview slide 4Dibs Retail Analysis (99K Transactions) preview slide 5
99,461 Transactions

Dibs Retail Analysis (99K Transactions)

PythonPandasNumPyMatplotlibSeabornEDABusiness Analytics
99,461retail transactions analysed across 10 variables

Analysed 99,461 retail transactions across customer, product category, payment method, date, quantity, price, and shopping mall variables to identify revenue drivers, customer behaviour patterns, and marketing opportunities.

10 Variables5,024 Price Outliers Treated46.3M TL Highest Age Group Spend49.9% Cash Payment ShareRetail Customer Analytics

Dashboard & Business Intelligence Projects

SQL analytics, data modelling, and interactive dashboards.

03 projects
Victoria Road Crash Analytics Dashboard previewVictoria Road Crash Analytics Dashboard preview slide 1Victoria Road Crash Analytics Dashboard preview slide 2Victoria Road Crash Analytics Dashboard preview slide 3Victoria Road Crash Analytics Dashboard preview slide 4
5 Years of Data

Victoria Road Crash Analytics Dashboard

TableauPythonPandasGeospatial Analysis
5 yrsof Victorian crash data mapped into one dashboard

Built a Tableau dashboard analysing 5 years of Victorian road crash records (2018 2023), visualising hotspots, severity trends, and risk factors for road safety analysis.

Tableau DashboardGeospatial AnalysisRoad Safety Insights
Urban Eats SQL Analysis preview
SQL Analytics

Urban Eats SQL Analysis

SQLSQLiteDatabase DesignERD
Multi tableSQL schema designed for café operations reporting

Designed relational database structures and wrote SQL queries to generate business insights and reporting for retail and café operations.

Database DesignBusiness ReportingData Modelling
Australian Population Trends Dashboard (Power BI) preview
Power BI

Australian Population Trends Dashboard (Power BI)

Power BIDAXData ModellingETL
24.18Mpeople mapped across 20 years of ABS census data

Built Power BI dashboards using ABS census data (1996 to 2016) to analyse Australia's population growth, age structure, gender split, and country of birth diversity across all states and territories, supporting planning for infrastructure, healthcare, and education. Found Australia reached 24.18M total population with 8.28% growth, driven primarily by NSW, VIC, and QLD, with 91.11% Australian born and strongest overseas born shares from New Zealand and China.

24.18M PopulationABS Census 1996 2016Demographic Segmentation

Machine Learning Projects

Applied machine learning, computer vision, and deep learning research.

02 projects
Maternal & Neonatal Outcome Prediction preview
61,018 Records

Maternal & Neonatal Outcome Prediction

PythonScikit-learnPandasHealthcare Analytics
61,018birth records modelled across Kenya & Uganda

Predicted adverse maternal and neonatal birth outcomes using machine learning on 61,018 healthcare records from Kenya and Uganda. Compared multiple classification models including Random Forest, Decision Tree, KNN, and Logistic Regression to identify key risk factors and support data driven healthcare decision making.

Random ForestHealthcare AnalyticsPredictive Modelling
Mobile Price Predictor preview
2,000 Records

Mobile Price Predictor

PythonScikit-learnLogistic RegressionKNN
97.25%accuracy predicting phone price tier (LogReg)

Built classification models on 2,000 mobile phone records with 20 hardware features (battery, RAM, camera, resolution, connectivity) to predict price range across 4 tiers: low, medium, high, very high. Compared Logistic Regression and K Nearest Neighbors with grid search hyperparameter tuning, identifying RAM, battery power, and display resolution as the strongest price drivers.

LogReg 97.25%KNN K=11Scikit-learn

Research Projects

Deep learning and computer vision research conducted with Masters research teams.

02 projects
UAV Maize Tassel Detection preview
Team · Computer Vision Engineer
YOLOv5

UAV Maize Tassel Detection

PythonPyTorchYOLOv5Detectron2Computer Vision
2 modelsbenchmarked on UAV maize imagery (YOLOv5 vs Detectron2)

Team research project applying deep learning object detection to UAV imagery for identifying maize tassels, supporting precision agriculture and aerial crop monitoring. Compared YOLOv5 and Detectron2 architectures to evaluate detection performance on agricultural drone footage.

Detectron2Computer VisionDeep Learning
Tooth Decay Detection Using Deep Learning preview
Team · Deep Learning Engineer
Medical Imaging

Tooth Decay Detection Using Deep Learning

PythonTensorFlowPyTorchMedical Imaging
4 modelscompared for dental decay detection from phone imagery

Team research project building computer vision models to detect tooth tissue destruction from smartphone microphotography, supporting automated dental diagnostics and early disease detection. Compared YOLOv5, Detectron2, FCOS, and MobileNetV3 architectures to identify the most effective approach for dental image analysis.

Deep LearningTensorFlowPyTorch

Group & Collaborative Projects

Team based business analytics and capstone projects, with my specific contributions highlighted on each card.

02 projects
LuminaTech Lighting: Customer Insights (BUSA8000) preview
Team · Customer Insights & Data Quality Lead
1.99M Records

LuminaTech Lighting: Customer Insights (BUSA8000)

1.99Msales records audited; 40.5% customer churn surfaced

Team business analytics project for Macquarie's BUSA8000, analysing ~1.99M LuminaTech Lighting sales records across 2012 to 2013 to support customer retention, sales strategy, and operational decisions. Focused on data quality, customer base trends, churn behaviour, and EDA to underpin downstream statistical testing and predictive modelling by the team.

EDA & Data CleaningCustomer AnalyticsPython · Pandas
Used Car Price Prediction: Kaggle Competition preview
Team · Task 1 Lead: Data Preparation & EDA
12K Listings

Used Car Price Prediction: Kaggle Competition

PythonPandasFeature EngineeringEDA
12K × 38used car listings cleaned across 38 raw features

Team Kaggle competition predicting listed prices for ~12,000 used cars across 38 raw features (engine, drivetrain, dimensions, geography, listing metadata). The team trained and tuned regression models against a held out leaderboard; my workstream owned Task 1: turning the messy raw listings into a clean, model ready dataset and surfacing the price drivers the modelling team built on.

38 FeaturesEDA & Feature EngineeringPython · Pandas

06: Experience

Work & research

Dispatch Team Member (Operations & Process)

WooliesX· Auburn, Australia

Jan 2026: Present · Part time

Analysed operational workflows, inventory validation processes, dispatch performance, issue resolution, and process efficiency within a highly automated customer fulfilment centre.

Research Assistant: Machine Learning & Computer Vision

North South University· Dhaka, Bangladesh

Jan 2023: Dec 2023 · Full time

Worked on dataset preparation, machine learning model training, and model evaluation for computer vision research using YOLOv5 and Detectron2, with a focus on object detection and research documentation.

07: Contact

Let's build something with data.

Currently seeking Junior Data Analyst, Data Scientist, Business Analyst, Analytics Consultant, and Machine Learning opportunities across Australia and remote first teams. The best way to reach me is by email or LinkedIn message.